Quantcast
Channel: ntop
Viewing all 544 articles
Browse latest View live

Using sysdig from PF_RING (and soon from all ntop apps)

$
0
0

Months ago Draios Inc introduced sysdig a kernel module and user-space library for capturing systems events and thus analyse what is happening on a Linux box. The idea has been immediately appealing for us at ntop, this for many reasons:

  1. With our tools we can analyse network packets, extract metadata (e.g. URLs, network delays, username who has performed a certain action), but up to the system. In essence even though we install ntopng or nProbe onto a Linux box (either physical or virtual), we currently see packets and we miss the system interactions: process A speaks with process B that sends a HTTP request to xyz.com. We see the HTTP request to xyz.com but we have no clue what is the process doing what.
  2. We have used SNMP many years ago (to be honest I started with OSI) and we know that these paradigms do not cope with dynamic environments. We needed something better.
  3. Using sysdig is a lot of fun, but it’s yet another environment, that requires its APIs, its programming language (the high-level library is write in C++11)… in essence you have to accept the rules.
  4. When we have created our tools to play with sysdig, we have realised that merging packets with system calls was not simple as PF_RING was receiving packets on a certain way, sysdig on a similar yet orthogonal way, with the result that merging information coming from the system and from the network was not as easy as we expected.

On the other hand we know that we have been playing with packets for 15 years now, and we did not like to drop all our beloved PF_RING based tools in favour of sysdig, simply because these two approaches were close but not close enough to make our life easy. This has been the driving force to integrate sysdig-generated events into PF_RING. To enable us to reuse all our tools (even non-ntop tools such as tcpdump or wireshark) and see sysdig as yet another network interface, but nothing different than that.

Inside the PF_RING SVN code (this code will go into the next stable PF_RING release that will be out soon),we have integrated sysdig. Our way. Namely once the sysdig kernel module is loaded in the kernel, the user-space PF_RING code will not need any sysdig library. This way we have removed dependencies on sysdig pre-requisites (e.g. C++11) and we have made sysdig a native PF_RING component. Now you can do things like:


 root@ubuntu:/home/deri/PF_RING/userland# ./examples/pfcount -i sysdig -v 1
 Using PF_RING v.6.0.2
 Capturing from sysdig
 # Device RX channels: 1
 # Polling threads: 1
 22:30:29.932674439 [cpu_id=0][tid=1292][1|> syscall]
 22:30:29.932675107 [cpu_id=0][tid=1292][0|< syscall]
 22:30:29.932675377 [cpu_id=0][tid=1292][1|> syscall]
 22:30:29.932676611 [cpu_id=0][tid=1292][8|< write]
 22:30:29.932689184 [cpu_id=0][tid=1292][9|> write]
 22:30:29.932692526 [cpu_id=0][tid=1292][82|< select]
 22:30:29.932695822 [cpu_id=0][tid=1292][152|< switch]

or (below you will see tcpdump compiled with PF_RING libraries)

 root@ubuntu:/home/deri/PF_RING/userland/tcpdump-4.1.1# ./tcpdump -i sysdig
 tcpdump: WARNING: SIOCGIFADDR: sysdig: No such device
 Warning: Kernel filter failed: Socket operation on non-socket
 tcpdump: verbose output suppressed, use -v or -vv for full protocol decode
 listening on sysdig, link-type EN10MB (Ethernet), capture size 8192 bytes
 20:31:09.596548771 90:13:ae:3a:00:00 (oui Unknown) > a3:de:c4:b0:77:39 (oui Unknown) Null Information, send seq 16, rcv seq 0, Flags [Command], length 18
 20:31:09.596554873 90:13:ae:3a:00:00 (oui Unknown) > 79:f6:c4:b0:77:39 (oui Unknown) Null Information, send seq 16, rcv seq 0, Flags [Command], length 18
 20:31:09.596556288 90:13:ae:3a:00:00 (oui Unknown) > 00:fc:c4:b0:77:39 (oui Unknown) Null Information, send seq 16, rcv seq 0, Flags [Command], length 18
 20:31:09.596556954 90:13:ae:3a:00:00 (oui Unknown) > 9a:fe:c4:b0:77:39 (oui Unknown) Null Information, send seq 37, rcv seq 0, Flags [Command], length 60
 20:31:09.596560287 90:13:ae:3a:00:00 (oui Unknown) > 9f:0b:c5:b0:77:39 (oui Unknown) Null Information, send seq 25, rcv seq 0, Flags [Command], length 36
 20:31:09.596578107 90:13:ae:3a:00:00 (oui Unknown) > 3b:51:c5:b0:77:39 (oui Unknown) Null Information, send seq 11, rcv seq 0, Flags [Command], length 8
 

As you have seen sysdig is now a virtual network interface (-i sysdig) and all the rest is the same. Nice isn’t it?

Well there’s much more than that. In particular you can have fun when using sysdig from PF_RING ZC (NOTE: you do not need a ZC license for using it in combination with sysdig). Some examples (you can read all details in this file):

  • Example 1. Hash incoming sysdig events and read them on 2 threads balancing them per PID
    PF_RING/userland/examples_zc# ./zbalance -i sysdig -c 4 -m 0 -r 1 -g 2:3
  • Example 2. Hash incoming packets and read them on 2 processes
    PF_RING/userland/examples_zc# ./zbalance_ipc -i sysdig -c 99 -n 2 -m 0 -g 1
    
    PF_RING/userland/examples_zc# ./zcount_ipc -c 99 -i 0 -g 2 -s
    PF_RING/userland/examples_zc# ./zcount_ipc -c 99 -i 1 -g 3 -s
  • Example 3. Hash incoming packets and read them on 2 non-ZC applications
    PF_RING/userland/examples_zc# ./zbalance_ipc -i zc:eth2 -c 99 -n 2 -m 0 -g 1
    
    PF_RING/userland/examples# ./pfcount -i zc:99@0 -v 1 -q
    PF_RING/userland/examples# ./pfcount -i zc:99@1 -v 1 -q
    
  • Example 4. Enqueue incoming sysdig events to a pipeline with 2 threads
    PF_RING/userland/examples_zc# ./zpipeline -i sysdig -c 99 -g 2:3 
    
  • Example 5. Enqueue incoming sysdig events to a queue, on another process forward packets from the queue to another queue, send packets from the second queue to an egress interface (perhaps we should first encapsulate the events into a ethernet frame for best results)
    PF_RING/userland/examples_zc# ./zpipeline_ipc -i sysdig,0 -o zc:eth3,1 -n 2 -c 99 -r 1 -t 2
    
    PF_RING/userland/examples_zc# ./zbounce_ipc -c 99 -i 0 -o 1 -g 3
    

    Note that the zbounce_ipc application can run on a VM, and a pipeline with multiple VMs can be created allocating more queues.

In essence using sysdig over PF_RING:

  1. You do not have anymore the limitation of running 1 (quantity one) sysdig-based application simultaneously.
  2. You can run your apps on a physical system or on a VM. For instance from inside a VM you can read the events coming from the physical system that hosts the VM. In zero copy at high speed.
  3. You can use n2disk to write to disk at high speed (being us able to written 20Gbit to disk with n2disk, is also possible to do the same with sysdig), handling system events similar to packets.
  4. You can read system events and packets simultaneously (e.g. have a look at apps like pfcount_bundle that can read packets from n-devices simultaneously and merge them) using one single API, from your existing app. The only difference is that you have to be able to interpret system events properly similar to what pfcount is doing on the example above.
  5. All this at line rate, in zero-copy, from a physical host or a VM. Free of charge (no license needed) using PF_RING ZC.

We hope we can foster the development of sysdig-based applications thanks to our work. Enjoy!


Active vs Passive Polling in Packet Processing

$
0
0

From time to time, PF_RING users ask us whether they should use passive polling techniques (i.e. call pfring_poll()) or use active polling that basically means to implement an active loop until the next packet to process becomes available. All those who have read a programming book or attended university classes, might answer that polling is the answer. This also for various other reasons including energy saving in CPUs.  Unfortunately in practice the story is a bit different.

If you want to avoid wasting CPU cycles, when you have nothing to do (i.e. no packet is waiting to be processed), you should either call pfring_poll(), poll/select and ask the system to wake up the program when there is a packet to process. If you create an active polling loop you might want to do something like

while(<no packet available>) { usleep(1); }

that reduces the CPU loop taking (in theory) a short (one microsecond) nap. This is a good practice if usleep() (or nanosleep() if you prefer to use it instead of usleep()) last the time you specify. Unfortunately this is not always the case. These functions make a system call to implement the sleep. The cost of a simple system call is pretty low (e.g. you can test it using this test program) and is usually less than 100 nsec/call that is much less than 1 usec sleep we want to have. Let’s now measure the accuracy of usleep() and nanosleep() using this simple program (sleep.c)

#include <string.h>
#include <sys/time.h>
#include <stdio.h>

double delta_time_usec(struct timeval *now, struct timeval *before) {
  time_t delta_seconds;
  time_t delta_microseconds;

  delta_seconds      = now->tv_sec  - before->tv_sec;

  if(now->tv_usec > before->tv_usec)
     delta_microseconds = now->tv_usec - before->tv_usec;
  else
    delta_microseconds = now->tv_usec - before->tv_usec + 1000000;  /* 1e6 */

  return((double)(delta_seconds * 1000000) + (double)delta_microseconds);
}

int main(int argc, char* argv[]) {
  int i, n = argc > 1 ? atoi(argv[1]) : 100000;
  static struct timeval start, end;
  struct timespec req, rem;
  int how_many = 1;

  gettimeofday(&start, NULL);
  for (i = 0; i < n; i++)
    usleep(how_many);
  gettimeofday(&end, NULL);

  printf("usleep(1) took %f usecs\n", delta_time_usec(&end, &start) / n);

  gettimeofday(&start, NULL);
  for (i = 0; i < n; i++) {
    req.tv_sec = 0, req.tv_nsec = how_many;
    nanosleep(&req, &rem);
  }
  gettimeofday(&end, NULL);

  printf("nanosleep(1) took %f usecs\n", delta_time_usec(&end, &start) / n);
}

The results change slightly from machine to machine but they are around 60 usec.

# ./sleep
usleep(1) took 56.248760 usecs
nanosleep(1) took 65.165280 usecs

This means that both usleep and nanosleep() when are used to sleep for 1 microsecond in practice they sleep for about 60 microseconds. This result is not surprising and it has been also observed by others [1] [2].

What does this mean in practice? Knowing that at 10G line rate you receive a packet every 67 nsec, sleeping for 60 usec means that you will receive about 895 packets during this time and that you must have good buffers to handle this situation. It also means that you cannot do any polling but use pure active polling (i.e. do not call any usleep/nanosleep in your active packet poll) in critical situations such as when you are time-merging packets from two network adapters.

Conclusion. Active polling is not elegant but when processing packets at high rate it might be compulsory in order to achieve great/accurate results. PF_RING applications support both passive and active polling. For instance in pfcount you can use the -a flag to force active packet polling and thus (in some cases) increase the packet capture performance at a cost of loading your CPU core at 100% (i.e. when you use active polling make sure you also bind your application to a core; in pfcount you can do it with -g).

Released nDPI 1.5.1 and ntopng 1.2.1

$
0
0

Today we have released a maintenance version of both nDPI and ntopng that address minor issues present in the previous stable release. In particular for ntopng we have addressed many small security holes identified by security researchers (our thanks go to Luca Carettoni), and thus we encourage you to upgrade when possible; note that for all these attacks you needed a valid ntopng user and password before to perform them, so their danger level is not too high, but still we encourage you too upgrade. Finally this release contains patches and enhancements courtesy of Debian maintainer Ludovico Cavedon who has packaged both ntopng and nDPI apps for Debian/Ubuntu.

nDPI Changelog

  • Added support for SSL client/server certificate export in nDPI flows
  • Added missing -lrt and -lnl libraries required when compiling the demo ndpiReader application with PF_RING..
  • json-c is now optional for the demo ndpiReader application.
  • Added missing symbols not previously exported by the nDPI shared library.
  • Fixes for Mac OSX HomeBrew package.

ntopng Changelog

  • Various fixes to prevent security attacks
    • CSRF attacks
    • XSS attacks
    • Local file inclusion now checks paths (globbing) even for authenticated users
    • Added check for CRSF attacks (http://en.wikipedia.org/wiki/Cross-site_request_forgery)
    • Added extra checks for preventing XSS (http://en.wikipedia.org/wiki/Cross-site_scripting)
    • Fix for Set-Cookie HttpOnly
    • Added X­Frame­Options: DENY in http headers to prevent clickjacking attacks
    • Specified charset ISO­8859­1 in HTML resposes to avoid attackers to bypass application’s defensive filters
  • Fixes for
    • CVE-2014-5464 – Steffen Bauch
    • CVE-2014-4329 – Madhu Akula
    • CVE-2014-5511, CVE-2014-5512, CVE-2014-5513, CVE-2014-5514, CVE-2014-5515 – Luca Carettoni
  • Patches for CentOS 7, Mac OSX HomeBrew, and Debian package.
  • Various minor fixes.

Running ntopng and nDPI on MacOSX

$
0
0

On Mac OS X users expect simple tool packaging and installation. Initially we planned to distribute .dmg files containing our apps, but then we have decided that in order to support current and future OSX version more easily, this was not the way to go. For this reason we have added support for packaging systems such as HomeBrew (and soon) MacPorts (work is still ongoing but close to the end).

Today if you want to run ntopng and nDPI on your OSX box you have the option to:

  1. compile everything by hand (this is good for developers or those who want to use the code in SVN) as you would do on every Unix box.
  2. use homebrew to build the stable version of our tools in a matter of minutes.

The steps you need to follow are simple

  1. Install homebrew or update your existing installation as shown below.
    # brew update
    Checking out files: 100% (845/845), done.
    Updated Homebrew from 4b55aa57 to 0cb85ea5.
    ==> New Formulae
    argyll-cms	  datamash	    git-latexdiff     ipv6toolkit	libtins		  onepass	    stuntman	      volatility
    bokken		  dnsrend	    gnu-cobol	      jbake		makeself	  pianod	    sync_gateway      whitedb
    ccm		  doitlive	    golo	      jetty-runner	mighttpd2	  profanity	    syncthing	      yubico-piv-tool
    cmockery2	  espeak	    grsync	      ldc		ndpi		  qwtpolar	    terraform
    codequery	  fpc		    hachoir-metadata  librcsc		ntopng		  soccerwindow2	    transcrypt
    csfml		  freeswitch	    harbour	      libsecret		ocamlsdl	  ssdb		    ttylog
    cwm		  geographiclib	    ipinfo	      libstrophe	omega		  storm		    udpxy
    ==> Updated Formulae
    aamath			      cadaver			    ddate			  
    ....
    
  2. Build ntopng as follows (you can do the same for ndpi):
    # brew install ntopng
    ==> Downloading https://downloads.sf.net/project/machomebrew/Bottles/ntopng-1.2.1.mavericks.bottle.tar.gz
    ######################################################################## 100.0%
    ==> Pouring ntopng-1.2.1.mavericks.bottle.tar.gz
      /usr/local/Cellar/ntopng/1.2.1: 292 files, 6.4M
    # brew test ntopng
    Testing ntopng
    ==> /usr/local/Cellar/ntopng/1.2.1/bin/ntopng -h
    
  3. Now it is time to start ntopng:
    # sudo ntopng
    12/Sep/2014 08:32:34 [Ntop.cpp:586] Setting local networks to 192.168.1.0/24,0.0.0.0/32,224.0.0.0/8,239.0.0.0/8,255.255.255.255/32,127.0.0.0/8
    12/Sep/2014 08:32:34 [Redis.cpp:74] Successfully connected to Redis 127.0.0.1:6379
    12/Sep/2014 08:32:34 [PcapInterface.cpp:81] Reading packets from interface en0...
    12/Sep/2014 08:32:34 [Ntop.cpp:710] Registered interface en0 [id: 0]
    12/Sep/2014 08:32:34 [PcapInterface.cpp:81] Reading packets from interface en1...
    12/Sep/2014 08:32:34 [Ntop.cpp:710] Registered interface en1 [id: 1]
    12/Sep/2014 08:32:34 [PcapInterface.cpp:81] Reading packets from interface lo0...
    12/Sep/2014 08:32:34 [Ntop.cpp:710] Registered interface lo0 [id: 2]
    12/Sep/2014 08:32:34 [Utils.cpp:233] Privileges are not dropped as we're not superuser
    12/Sep/2014 08:32:34 [main.cpp:184] PID stored in file /var/tmp/ntopng.pid
    Error Opening file /usr/local/Cellar/ntopng/1.2.1/share/ntopng/httpdocs/geoip/GeoIPASNum.dat
    12/Sep/2014 08:32:34 [Geolocation.cpp:59] WARNING: Unable to read GeoIP database /usr/local/Cellar/ntopng/1.2.1/share/ntopng/httpdocs/geoip/GeoIPASNum.dat
    Error Opening file /usr/local/Cellar/ntopng/1.2.1/share/ntopng/httpdocs/geoip/GeoIPASNumv6.dat
    12/Sep/2014 08:32:34 [Geolocation.cpp:59] WARNING: Unable to read GeoIP database /usr/local/Cellar/ntopng/1.2.1/share/ntopng/httpdocs/geoip/GeoIPASNumv6.dat
    Error Opening file /usr/local/Cellar/ntopng/1.2.1/share/ntopng/httpdocs/geoip/GeoLiteCity.dat
    12/Sep/2014 08:32:34 [Geolocation.cpp:59] WARNING: Unable to read GeoIP database /usr/local/Cellar/ntopng/1.2.1/share/ntopng/httpdocs/geoip/GeoLiteCity.dat
    Error Opening file /usr/local/Cellar/ntopng/1.2.1/share/ntopng/httpdocs/geoip/GeoLiteCityv6.dat
    12/Sep/2014 08:32:34 [Geolocation.cpp:59] WARNING: Unable to read GeoIP database /usr/local/Cellar/ntopng/1.2.1/share/ntopng/httpdocs/geoip/GeoLiteCityv6.dat
    12/Sep/2014 08:32:34 [HTTPserver.cpp:351] HTTPS Disabled: missing SSL certificate /usr/local/Cellar/ntopng/1.2.1/share/ntopng/httpdocs/ssl/ntopng-cert.pem
    12/Sep/2014 08:32:34 [HTTPserver.cpp:352] Please read https://svn.ntop.org/svn/ntop/trunk/ntopng/README.SSL if you want to enable SSL.
    12/Sep/2014 08:32:34 [HTTPserver.cpp:389] Web server dirs [/usr/local/Cellar/ntopng/1.2.1/share/ntopng/httpdocs][/usr/local/Cellar/ntopng/1.2.1/share/ntopng/scripts]
    12/Sep/2014 08:32:34 [HTTPserver.cpp:392] HTTP server listening on port 3000
    12/Sep/2014 08:32:34 [main.cpp:232] Working directory: /var/tmp/ntopng
    12/Sep/2014 08:32:34 [main.cpp:234] Scripts/HTML pages directory: /usr/local/Cellar/ntopng/1.2.1/share/ntopng
    12/Sep/2014 08:32:34 [Ntop.cpp:206] Welcome to ntopng x86_64 v.1.2.1 (r1.2.1) - (C) 1998-14 ntop.org
    12/Sep/2014 08:32:34 [PeriodicActivities.cpp:53] Started periodic activities loop...
    12/Sep/2014 08:32:34 [RuntimePrefs.cpp:32] Dump alerts into syslog
    12/Sep/2014 08:32:34 [NetworkInterface.cpp:800] Started packet polling on interface en0 [id: 1]...
    12/Sep/2014 08:32:34 [NetworkInterface.cpp:800] Started packet polling on interface en1 [id: 3]...
    12/Sep/2014 08:32:34 [NetworkInterface.cpp:800] Started packet polling on interface lo0 [id: 5]...


    Note that if you want you can install the GeoIP dat files (for geolocating hosts) by downloading them

    # cd /usr/local/Cellar/ntopng/1.2.1/share/ntopng/httpdocs/geoip/
    # wget -nc http://geolite.maxmind.com/download/geoip/database/GeoLiteCity.dat.gz
    # wget -nc http://geolite.maxmind.com/download/geoip/database/GeoLiteCityv6-beta/GeoLiteCityv6.dat.gz
    # wget -nc http://download.maxmind.com/download/geoip/database/asnum/GeoIPASNum.dat.gz
    # wget -nc http://download.maxmind.com/download/geoip/database/asnum/GeoIPASNumv6.dat.gz
    # gunzip *.dat.gz

Time to enjoy ntopng (and nDPI) on Mac OSX!

PF_RING 6.0.2 Released: DKMS, Sysdig, Hardware Timestamps and much more

$
0
0

Today we have released a maintenance release of PF_RING that includes many fixes and enhancements. In particular:

  • we have moved our binary packages over DKMS that will make them independent from kernel version that caused you to update whenever a new kernel version was released. Thanks to DKMS this is no longer necessary.
  • We have added sysdig support into PF_RING, so that your PF_RING applications can open the virtual deveice “sysdig” for reading system events without requiring the sysdig library that adds complexity in code development

Changelog:

  • PF_RING Library
    • New Ixia hw timestamp support
    • New sysdig module
    • Userspace bpf filtering with pfring_set_bpf_filter() when kernel
    • bypass is used (DNA/Libzero/ZC)
    • Fixed fd leak
  • ZC Library
    • New API to add/remove hw filters: pfring_zc_add_hw_rule()/pfring_zc_remove_hw_rule()
    • New API to check tx queue status: pfring_zc_queue_is_full()
    • New API to sort traffic based on hw ts: pfring_zc_run_fifo()
    • New API to export stats in /proc: pfring_zc_set_proc_stats()
    • New API to hash packets based on GTP: pfring_zc_builtin_gtp_hash()
    • Hw ts support: new PF_RING_ZC_DEVICE_HW_TIMESTAMP, PF_RING_ZC_DEVICE_STRIP_HW_TIMESTAMP flags
    • Ixia ts support: new PF_RING_ZC_DEVICE_IXIA_TIMESTAMP flag
    • PPPoE support in pfring_zc_builtin_ip_hash()
    • Fix for huge memory allocation
    • Fix for stack injection
    • Fix for ZC cluster destroy
  • PF_RING kernel module
    • MPLS support
    • Support for huge rings (new ring version 16)
    • Fixed send for packet len = max frame size + vlan
    • Fix for huge memory allocation with standard pf_ring/libzero
    • Fixed 64 bit division on 32 bit systems
    • Fixed cluster hash
    • Fix for multichannel devices
    • DKMS support
  • PF_RING
    • aware/ZC Drivers
    • Hw filtering support in ixgbe
    • ZC driver (Intel 82599
    • based cards)
    • e1000e driver update v.3.0.4.1
    • ixgbe driver update v.3.21.2
    • numa node fix
    • new parameter allow_tap_1g to handle 1gbit/s TAP
    • DKMS support
  • DNA Drivers
    • e1000e driver v.2.5.4 vlan stripping disabled
    • DKMS support
  • PF_RING
    • aware Libpcap
    • New PCAP_PF_RING_RECV_ONLY env var to open socket in rx only
    • Fix for libpcap VLAN issues with LINUX_SLL
    • Fix for cpu spinning on pcap_read_packet()
    • Fix for userspace bpf with libzero/zc virtual interfaces
    • Fix for VLAN filtering
  • Examples
    • pfcount: userspace bpf fix
    • pfsend: fixed division by 0 with empty pcaps
    • pfbridge: added bpf support
    • pfdnacluster_master: added PPPoE support to hash
    • New zfifo example
    • zbalance: round
    • robin mode fix
    • zbalance_ipc
    • ability to spread packets across multiple instances of multiple applications in IP and GTP hash mode
    • ability to configure queue len
    • added support for n2disk10g multithread
    • Added zbalance_ipc zsend zcount zcount_ipc to the Ubuntu package
    • Added zbalance_ipc zsend zcount zcount_ipc to the RPM package

Introducing nProbe v7

$
0
0

After more than three years of work, we are announcing the release of nProbe v7. This is a major evolution of v6 that many of you used in the bast few years. In essence we have worked a lot for improving the application performance, supporting new protocols (including mobile 3G/LTE network monitoring), adding new information elements and moving towards an accurate probe. nProbe still exports the data in NetFlow/IPFIX but we have opened it to new ways of handling monitoring data (e.g. using Splunk and ElasticSearch). This because today we cannot monitor traffic up to layer 4 as many probes still do. People want to see what happens at application level, know what processes are doing what (in terms of network traffic, CPU, I/O) and with whom are speaking to. For years network monitoring has been perceived as a special problem with special solutions. We do not think this statement is still true. nProbe is a data source, that can emit data using legacy formats (e.g. IPFIX/NetFlow) or on more “modern” formats as previously discussed on this blog. ntopng can be used as web console for nProbe so that you can have a complete probe/collector solution, even though you can still use your favourite flow collector.

The main changes are listed below:

  • Various fixes for improving probe reliability
  • Support for multi-tag VLAN packets
  • Added Layer-7 traffic categorisation (via nDPI)
  • Flow export in JSON format for integration with products such as ElasticSearch and Splunk
  • Implemented de-duplication of IPv4 packets
  • Redesigned hash implementation to improve overall performance
  • Added support for PF_RING clusters and non-commodity adapters
  • Improved flow and packet sampling
  • Support of encapsulations such as GTP (v0, v1, v2), PPP (including multilink), ERF (Endace), PPPoE, ESP, GRE, Mobile IP
  • Added SCTP support
  • Enhanced CPU binding and core affinity
  • Implemented smart UDP fragment handling for reducing fragment processing overhead
  • Added ability to specify a black list of IP networks for discarding specific flows
  • Added ability to account layer-2 traffic into flows
  • Implemented ability to dump on pcap files suspicious packets (e.g. those that cannot be decoded properly)
  • Added ability to handle hardware timestamped packets such as those generated by specialised hardware NICs and IXIA devices
  • Replaced FastBit support with MySQL/InfiniDB for flow dump on a database
  • Improved flow generation capability when using pcap files instead of live capture
  • Added support of microcloud for creating a distributed probe knowledge base
  • Improved application/network latency computation that is now also computed in the middle of a TCP connection and not just at the beginning
  • Major improvements in various plugins such as HTTP, VoIP (SIP, RTP) and DNS
  • Added plugins for decoding GTP-C traffic (V0, v1, v2)
  • Added DHCP, FTP, POP3, IMAP, Oracle, MySQL, whois plugins
  • Added process plugin for monitoring system activities and combining them with network traffic
  • Implemented enhanced VoIP plugins that feature voice quality (pseudo-MOS/R-Factor) measurement
  • Support of Windows x64 (Win32 is now an obsoleted platform).

In the coming days we will introduce in detail some major features of this new release such as the process plugin (that inspects in detail application traffic) and VoIP analysis plugins that report you about voice quality.

nProbe is available in both binary (for selected platforms such as Windows x64 and CentOS/Ubuntu server) and source format. Plugins are available only in binary format and we’ll evaluate case-by-case the release of their source (e.g. research institutions).


Enjoy!

Combining System and Network Visibility using nProbe and Sysdig

$
0
0

Introduction


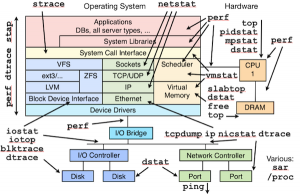
When in 1998 we have started the development of the original ntop, there were many Unix tools for monitoring network traffic: ping, tcpdump, netstat, and many others. Nevertheless we have decided to develop ntop, because there was no tool able to show on a simple way what was happening on our network. Early this year we have started the development of some experimental PF_RING kernel module extensions able to give ntop applications visibility of process activities, this in order to bind network traffic with a process name. We have lived once more the early ntop days when last May our friends at Draios have introduced sysdig and made all this mess below history.

System Monitoring Tools

We have therefore put our experimental code in the trash and started hacking on top of sysdig.


Our Vision: Combine System with Network Information


The idea is very simple: we want to associate a process name with every network activity, and monitor the process resources  (CPU, memory and I/O) used to carry on such activity. With flow-based paradigm what we see is depicted below.

Pre-sysdig

In essence we see hosts, ports, protocols and flows, but we lack visibility on the process that did all that. This has been the driving force to combine system with network monitoring, so that when system administrators see an increase in HTTP application response time, they can:

  1. Get the list of all the processes that were running when such HTTP request was served.
  2. Know what system resources were used by the process that served such request while serving such request (and not since process startup).

In essence we want empower system administrators and let them know what is happening on their system, also from the security point of view. You can finally know what is the name of the process that sent the packet-of-death so that you can find it on the system and neutralise it. As we’ve been playing with network flows for more than a decade, we believe that we can apply the same principle to system processes, by modelling them similar to flows.

In order to achieve all this we have extended our flow probe nProbe with sysdig, by developing a new process monitoring plugin that implements new information elements that can be exported via NetFlow/IPFIX or JSON to ntopng and other applications. The big challenge has been to monitor the system while keeping the CPU utilisation low, as busy systems can produce a lot of system events; for this reason we have implemented event filters so that nProbe analyses only those events that are necessary to carry on the job, while discarding the others inside the kernel (i.e. they are not sent by sysdig to the user-space app at all). The new information elements include:

[NFv9 57640][IPFIX 35632.168] %SRC_PROC_PID                Src process PID
[NFv9 57641][IPFIX 35632.169] %SRC_PROC_NAME                    Src process name
[NFv9 57844][IPFIX 35632.372] %SRC_PROC_USER_NAME               Src process user name
[NFv9 57845][IPFIX 35632.373] %SRC_FATHER_PROC_PID              Src father process PID
[NFv9 57846][IPFIX 35632.374] %SRC_FATHER_PROC_NAME             Src father process name
[NFv9 57855][IPFIX 35632.383] %SRC_PROC_ACTUAL_MEMORY           Src process actual memory (bytes)
[NFv9 57856][IPFIX 35632.384] %SRC_PROC_PEAK_MEMORY             Src process peak memory (bytes)
[NFv9 57857][IPFIX 35632.385] %SRC_PROC_AVERAGE_CPU_LOAD        Src process avg load (% * 100)
[NFv9 57858][IPFIX 35632.386] %SRC_PROC_NUM_PAGE_FAULTS         Src process num pagefaults
[NFv9 57865][IPFIX 35632.393] %SRC_PROC_PCTG_IOWAIT             Src process iowait time % (% * 100)
[NFv9 57847][IPFIX 35632.375] %DST_PROC_PID                     Dst process PID
[NFv9 57848][IPFIX 35632.376] %DST_PROC_NAME                    Dst process name
[NFv9 57849][IPFIX 35632.377] %DST_PROC_USER_NAME               Dst process user name
[NFv9 57850][IPFIX 35632.378] %DST_FATHER_PROC_PID              Dst father process PID
[NFv9 57851][IPFIX 35632.379] %DST_FATHER_PROC_NAME             Dst father process name
[NFv9 57859][IPFIX 35632.387] %DST_PROC_ACTUAL_MEMORY           Dst process actual memory (bytes)
[NFv9 57860][IPFIX 35632.388] %DST_PROC_PEAK_MEMORY             Dst process peak memory (bytes)
[NFv9 57861][IPFIX 35632.389] %DST_PROC_AVERAGE_CPU_LOAD        Dst process avg load (% * 100)
[NFv9 57862][IPFIX 35632.390] %DST_PROC_NUM_PAGE_FAULTS         Dst process num pagefaults
[NFv9 57866][IPFIX 35632.394] %DST_PROC_PCTG_IOWAIT             Src process iowait time % (% * 100)

Thanks to this new plugin it is possible to know for each flow peer the process name/PID/father-PID/memory/IO/CPU used during the duration of the flow. As this information is exported on a standard format, all flow collectors on the market can use nProbe generated flow to enhance their monitoring experience. However we have decided to do something special in ntopng to make system information a first class citizen.

Running the System


You can find binary, ready-to-use packages at

that you can install via apt-get or yum depending on your platform: you need to install nprobe, pf_ring and ntopng. Also remember that the sysdig kernel module must be loaded prior to run the system (i.e. do “sudo modprobe sysdig_probe”).

In order to activate system+network monitoring, you can start nProbe v7 (flow probe) as follows

nprobe -T “%IPV4_SRC_ADDR %L4_SRC_PORT  %IPV4_DST_ADDR %L4_DST_PORT %IN_PKTS %IN_BYTES
%FIRST_SWITCHED %LAST_SWITCHED” %TCP_FLAGS %PROTOCOL @PROCESS@ %L7_PROTO --zmq “tcp://*:1234”
-i any --dont-drop-privileges -t 5 -b 2

then start ntopng (flow collector – you need to use 1.2.1 or the code currently in SVN) as follows (note that you can merge process information coming from various hosts onto the same ntopng interface so that it is automatically merged):

ntopng -i tcp://nprobe1.ntop.org:1234,tcp://nprobe2.ntop.org:1234 …

At this point ntopng is ready to combine system with network activities as shown below. Note that as nProbe has visibility restricted to local system events, you need to install it on each system on which you want to have system visibility.

Click to view slideshow.

Visualising Flows and Processes on ElasticSearch/Kibana


If all this is not what you are looking for, we have also integrated ntopng with ElasticSearch, a flexible big-data system, that allows you to store flows on a distributed and replicated environment for long term historical analysis (just start ntopng adding -F es).

Click to view slideshow.

We are also developing custom dashboards built on top of Kibana, for letting you create in a few minutes your custom flow/process monitoring dashboard. Above you can find some sample dashboards.

What’s Next


At the moment we’re monitoring just processes that make network activities but the plan is to monitor all processes, regardless of them sending any byte on the wire. Furthermore we want to extend the ntopng process visibility with new reports to make processes/memory/users first class citizens.

Final Remarks


nProbe and the process plugin, as well ntopng are immediately available from http://packages.ntop.org packaged for CentOS and Ubuntu platforms. It is now time to really see what is really happening on your system going beyond the classic network flow monitoring paradigm.

If you want to learn more about this project, you’re welcome to attend the ntopng tutorial at the upcoming LISA 2014 conference that will take place next month in Seattle, WA.

How to Promote Scalability with PF_RING ZC and n2disk

$
0
0

The number of cores per CPU is growing at a rate governed by the Moore’s law. Nowadays even low-end CPUs come with at least 4/8 cores and people want to exploit all of them before buying a new machine. It is not uncommon to see people trying to squeeze on the same machine multiple applications (n2disk, nProbe, Snort, Suricata, etc.) that all need to analyze the same traffic, saving also money for network equipments for traffic mirroring (TAPs, etc.) while reducing complexity.

Both PF_RING ZC and n2disk have been designed to fully exploit the resources provided by multiple cores, using zero-copy packet fanout/distribution across multiple threads/processes/VMs in the former, scattering packet processing on multiple cores in the latter.

PF_RING ZC comes with a sample application (zbalance_ipc) able to send the same traffic in zero-copy to multiple applications, and at the same time balancing the traffic to multiple instances of each application using an hash function.

For instance, let’s assume we want to send all the traffic to n2disk and distribute it to 2 nprobe instances as in the picture below.

n2disk_mt_1

In this case we should run:

$ zbalance_ipc -i zc:eth1 -c 99 -n 2,1 -m 1 -S 0 -g 1

Where:

-i zc:eth1 is the ingress device (comma-separated list for traffic aggregation, e.g. -i zc:eth1,zc:eth2)
-c 99 is the cluster id (an arbitrary number)
-n 2,1 is the number of instances for each application, 2 nprobe and 1 n2disk
-m 1 is the hashing mode (1 – IP hash) for packet distribution across instances of the same application
-S 0 enables a time-stamping thread on core 0
-g 1 binds the main thread to core 1

After starting zbalance_ipc, we can run 2 nprobe instances using as interface name zc:99@0 and zc:99@1, and n2disk using zc:99@2.

(Please note that using our PF_RING-aware libpcap it is also possible to run legacy pcap-based applications just using the same interface names as above.)

Example:

$ n2disk -i zc:99@2 -o /storage -p 1024 -b 2048 -C 4096 -c 4 -w 5

Where

–interface|-i zc:99@2 is the ingress queue (cluster 99 queue 2 from zbalance_ipc)
–dump-directory|-o /storage is the directory where dump files will be saved
–max-file-len|-p 1024 is the max pcap file length (MBytes)
–buffer-len|-b 2048 is the buffer length (MBytes)
–chunk-len|-C 4096 is the size of the chunk written to disk (KBytes)
–reader-cpu-affinity|-c 4 binds the reader thread to core 4
–writer-cpu-affinity|-w 5 binds the writer thread to core 5

As said before, n2disk has been designed to fully exploit multiple cores. The minimum number of internal threads is 2, one for packet capture (reader) and one for disk writing (writer), but it is also possible to further parallelize packet capture and indexing using more threads.

If n2disk is generating an index with –index|-I (or compressing PCAPs with –pcap-compression|-M), it is possible to move compression from the writer thread to ad-hoc threads using –compressor-cpu-affinity|-z <core id list>. It is also possible to move packet indexing from the capture thread to the same threads using –index-on-compressor-threads|-Z.

n2dism_mt_2

Example:

$ n2disk -i zc:99@2 -o /storage -I -p 1024 -b 4096 -C 4096 -c 4 -z 5,6 -Z -w 7

Where:

–index|-I enables on-the-fly pcap-index
–compressor-cpu-affinity|-z 5,6 enables 2 compression threads binding them to cores 5 and 6
–index-on-compressor-threads|-Z enables indexing on the same threads used for compression (-z)

In order to achieve the best performance with n2disk, it is also possible to parallelize packet capture using multiple reader threads. Using the new ZC-based n2disk (“n2disk10gzc” part of the n2disk package available at http://packages.ntop.org) it is possible to do this also when capturing from a ZC queue (running as a consumer for zbalance_ipc).

n2disk_mt_3

In order to do this, the -N parameter is required when running zbalance_ipc:

$ zbalance_ipc -i zc:eth1 -c 99 -n 2,1 -m 1 -S 0 -g 1 -N 2

Where:

-N 2 configures zbalance_ipc to work with n2disk multi-thread (2 is the number of reader threads we will enable in n2disk)

Example:

$ n2disk10gzc -o /storage -I -p 1024 -b 4096 -C 4096 -c 4 -z 7,8 -w 9 -Z –cluster-ipc-attach –cluster-id 99 -i zc:99@2
–cluster-ipc-queues 5,6 –cluster-ipc-pool 6 –reader-threads 6,7

Where (all the following parameters are provided by zbalance_ipc):

–cluster-ipc-attach|-Y attaches n2disk to an external ZC cluster (zbalance_ipc)
–cluster-id|-X 99 specifies the ZC cluster id
–cluster-ipc-queues|-W 5,6 specifies the queue IDs to use for internal packet distribution
–cluster-ipc-pool|-B 6 specify the pool ID to use for buffers allocation
–reader-threads|-R 6,7 enables 2 reader threads binding then to cores 6 and 7

Now you know how to exploit all your CPU cores and thus maximise performance. Have fun!


Building a (Cheap) 2×10 Gbit (Continuous) Packet Recorder using n2disk and PF_RING

$
0
0

Continuous packet recorders are devices that capture network traffic and save it to disk. The term continuous means that this activity is performed “continuously” until the device is active and not just for a few minutes. At ntop we have developed two companion applications to be used on a packet recorder:

  1. n2disk is a software application that captures network at line rate (multi 10 Gbit) and dumps it to disk on pcap format. During packet capture, n2disk can also:
    1. Create a pcap index to be used for searching specific packets matching a BPF filter out of the captured traffic. In essence it speeds up an operation that without an index would required to read the full pcap from the beginning to the end.
    2. Compress captured traffic during capture to save disk space and thus decrease search time as the applications have to manipulate smaller pcap files. If you compile pcap-based applications on top of PF_RING-aware libpcap, all apps (e.g. tcpdump and wireshark) can read compressed pcap files seamlessly.
  2. disk2n is a software application of reproducing pcap files either at line rate or at the same capture speed, so that you can reproduce on your lab the same traffic conditions that happened when n2disk captured the traffic. Note that disk2n can reproduce any pcap file (not just those captured by n2disk) and that the amount of traffic to be reproduced can exceed the available memory (i.e. you can reproduce multiple pcap files in sequence that can be even more than a Terabyte in size).

In order to simplify the operations, we have created the free nBox web GUI that allows users to graphically start/stop/replay/filter/download traffic in a matter of clicks. All the above applications operate at multi-10 Gbit on top of PF_RING ZC that features not just high speed packet-capture and replay but also comes with free applications such as zero-copy packet balancers and fan-out to manipulate traffic prior to dump it to disk (e.g. send the same ingress packet to both n2disk and nProbe for generating traffic traces). All applications can operate on top of Intel network adapters and specialised NICs such as those manufactured by Napatech.

Traditionally packet recorders are expensive devices because they need a fast storage system, and also because manufacturers sometimes have charged an “extra” for high-end customers. At ntop we believe instead in simplicity and on the fact that we should give everyone the best technology at affordable prices, adding a low price tag enough for us to continue innovate though research. On this blog post we will explain how to build a packet recorder using n2disk and commodity hardware so that you can build it yourself.


Question 1: Intel or Napatech NICs?


Our readers know that we have pioneered packet capture on commodity hardware since many years, but at the same time PF_RING ZC also supports specialised NICs such as those manufactured by Napatech. If with PF_RING ZC on top of Intel adapters we can achieve 10G packet capture with 64 byte packets, why bother with Napatech NICs that sport many nice features (e.g. traffic balancing/filtering in hardware) for an extra cost? The answer to this question isn’t as simple as a yes/no, so we’ll try to clarify it in detail.

  • Intel Adapters
    • [+] Cheap network adapters, available from the shop around the corner.
    • [+] Natively supported by PF_RING ZC both in RX and TX line rate multi-10G.
    • [-] Packet timestamps computed in software (unless you use specialised NICs that will limit the capture performance as the packet payload is extended with the hardware timestamp).
    • [-] All non capture-related activities (e.g. filtering or balancing) happen on the CPU on PF_RING ZC. In order to do this you need extra CPU cores devoted to this activity and thus a much more expensive CPU.
    • [-] With small packets, the NIC transfers packets one-by-one putting pressure on the PCIe bus and thus increasing system utilisation with respect to Napatech.
    • [-] When capturing from multiple network adapters (e.g. from 2 x 10G ports), packet merging happens on n2disk at a cost of an extra CPU load. Due to this it is not possible to merge and index/compress packets at line rate on 20G. There is a workaround explained later on this post.
  • Napatech Adapters
    • [+] High-precision hardware timestamps, in-hardware packet filtering/slicing/balancing, large in-card memory buffers for virtually 0-packet loss even in worst cases.
    • [+] Very efficient packet transfer from NIC-to-CPU and special “capture” mode that significantly reduces CPU utilisation with respect to Intel. This means that the CPU you can use with Napatech NIC can be much cheaper and with fewer cores than the one you need to use with Intel.
    • [+] Merging of multiple 10G ports happens in hardware with high-precision timestamps, offloading the CPU for this task.
    • [-] Napatech NICs have an extra cost with respect to Intel NICs even though you can save money with CPU and storage as explained later on this post.

The good news is that PF_RING ZC masks all these differences, so for an end user operating a packet recorder on top of Intel or Napatech NICs is basically the same.


Question 2: What Storage System Do I Need?


At ntop we use 10k RPM SATA drives. You can use faster 15K RPM SAS drives or SSDs, but in our experience the speed increase you will have has a price tag in terms of higher price and smaller storage. So the user will decide but high-quality 10k RPM SATA drives are good. For 10 Gbit to disk you need at least 8 x drives, for 20G you need at least 16 disks. If you decide to use Napatech NICs, you need at least 10 or 20 drives instead, as Napatech NICs also captures the ethernet CRC slightly increasing the data volume (i.e. your NIC will send to the host more that 10 Gbit due to the ethernet header). In general these are the minimum you can buy. As 10K RPM SATA drives are usually 1 TB in size, (remember that at 20G you capture 2.5 GB/sec) you will probably want to use at least 16 drives for 10G and 24 drives for 20G in order to have a storage system adequate with your needs.

As previously explained, Napatech NICs do 2x10G merging in hardware, whereas with Intel we need to merge packets on the host. As you will probably want to index and (maybe also) compress the captured traffic, using Intel NICs you cannot achieve all this on top of packet merging. For this reason if you decide to use a Napatech NIC with n2disk, you can use one single RAID subsystem where you can store 20G. With Intel NICs you need two RAID subsystem: one for one NIC and one for the other. When you extract/filter packets, the nBox will transparently merge both NICs honouring packet timestamps (so in a way the result is the same). The drawback of this Intel-based solution is that we cannot do all this on a CPU node at 20G as the number of cores we will need will be too high. So at 20G for packet capture+index+compression you need respectively:

  • Intel
    • Dual CPU (2 NUMA nodes): each CPU will take care of one 10G network adapter.
    • As you need many cores (at least 6) you need to use for instance Intel E5-2677 or (better) E5-2690. In essence be prepared to spend 3k/4k USD just for the CPUs.
    • 2 x single-port 10G Intel adapters: you need to install one adapter per NUMA node (remember this caveat).
    • 2 x RAID controller, each driving 12 drives: you need to install one controller per NUMA node.
  • Napatech
    • Single node system. A 4-cores Intel E5-2643 is enough or (better) an E5-2677.
    • Single RAID controller.

For RAID controller you can use various products (e.g. this or this) depending on the number of drives and expandability.


Final Remarks


As described above on this article, ntop products support 2 x 10G to disk using both Intel and Napatech NICs. Goal of this article is to tell you what are the hardware components you need to buy for building yourself a continuous packet capture device. We have described the pros and cons of both platforms, and explained that the BOM (Bill Of Materials) for Intel and Napatech is different, but money-wise pretty close. Choosing one NIC or the other has impact on the server you need to buy and on its architecture. In essence is the user that will decide which solution best first its requirements, said that ntop support seamlessly both platforms using the same unified n2disk/nBox web interface.

Now it’s time to build yourself your first packet recorder device !


FAQ


Q. How can I build a 40 Gbit packet recorder?
A. Using Intel NICs you need a 4 nodes NUMA system, 4 NICs, 4 x 10G single-port adapters. Every node will save a portion of the traffic and during extraction ntop tools will merge directions. With Napatech you need a single node 8-core (fast) CPU or a dual-node NUMA system. Of course you need double the disks for sustaining speed.

Q. How can I build a system with hundred of TBs?
A. The cheapest solution is to use a RAID controller able to driver a SAS expander. The controller listed earlier on this post can drive up to 256 disks.

Q. What hardware system is adequate for building a 2 x 10G packet recorder?
A. There are many options available including Dell R720 (CPU E5-2690 v2, RAID controller Perc H710P) or Supermicro 2027R.

Accelerating Snort, Bro and Suricata with PF_RING ZC

$
0
0

Over the past few months we have spent quite some time to accelerate popular open-source IDS/IPS with PF_RING ZC. The result is that you now have the option to select your favourite security product as we support all, at no cost, using PF_RING ZC in both IDS and IPS mode. From our benchmarks we have seen that the acceleration with respect to vanilla Linux AF_PACKET is good even using  standard (non ZC) PF_RING. We will provide some test results in the near future, but in the meantime we invite you to test it yourself.

  • Snort
    The code for the PF_RING ZC-aware DAQ module can be found in the PF_RING SVN repository or part of our binary PF_RING packages.
  • Suricata
    We have contributed to the PF_RING support in Suricata and the current code includes our patches: the next stable release will include them. We have revamped PF_RING support updating the existing code adding:
    • Support for IPS/TAP (IDS was already supported since day 1).
    • Support of peering interfaces including sending traffic to it.

    In essence you can now use Suricata in both IDS and IPS mode at high speed.

  • BRO
    Since the release 2.3, BRO includes native PF_RING ZC support and many companies (including Facebook) are using it already: you can be the next one!

It’s now time to update your favourite IDS/IPS with PF_RING ZC!

Using ntop Applications with Docker and OpenStack

$
0
0

In order to ease the deployment of our applications, in addition to source code distribution, we have released binary packages (x64 and ARM) for CentOS/RedHat and Ubuntu/Debian. For PF_RING, that requires to be compiled against the installed kernel version, we have moved to DKMS so that you are no longer required to use the same kernel version we use for packaging it.

However the current trend is going towards virtualised environments (not just VMs such as VMware) and IaaS (Infrastructure as a Service) and thus we need to support them.


Docker


In essence there are two types of virtualisation:

  • Virtual Machine: emulation of a particular computer system, including its devices (network, storage, USB etc).
  • Operating-system level virtualisation: run multiple isolated user-space instances (often called containers) that look like a real server.

Docker is an open-source software that automates the deployment of applications inside software containers. Each container runs within a single Linux instance without the overhead of starting VMs. We have created a Docker container for ntopng (but others can be created for the other ntop apps) that allows you to run ntopng on a clean and isolated environment. We have built a dock on hub.docker.com

DockerHub

so that you can go to docker.com and search for ntopng Screen Shot 2014-11-04 at 13.26.03install it,

root@ubuntu:/home/deri# docker pull lucaderi/ntopng-docker
Pulling repository lucaderi/ntopng-docker
8077c18a90a8: Download complete
511136ea3c5a: Download complete
d497ad3926c8: Download complete
ccb62158e970: Download complete
e791be0477f2: Download complete
…
e072f31bb2a5: Download complete
9e52f4c92f80: Download complete
ecc46895937f: Download complete
3a3f2545e225: Download complete
4f1229fadea7: Download complete
5b5364929cbf: Download complete
Status: Downloaded newer image for lucaderi/ntopng-docker:latest

then run it

root@ubuntu:/home/deri# docker run --net=host --name ntopng -t -i lucaderi/ntopng-docker ntopng -v
….
02/Nov/2014 12:55:20 [main.cpp:183] PID stored in file /var/tmp/ntopng.pid
02/Nov/2014 12:55:20 [HTTPserver.cpp:374] HTTPS Disabled: missing SSL certificate /usr/share/ntopng/httpdocs/ssl/ntopng-cert.pem
02/Nov/2014 12:55:20 [HTTPserver.cpp:376] Please read https://svn.ntop.org/svn/ntop/trunk/ntopng/README.SSL if you want to enable SSL.
02/Nov/2014 12:55:20 [HTTPserver.cpp:420] Web server dirs [/usr/share/ntopng/httpdocs][/usr/share/ntopng/scripts]
02/Nov/2014 12:55:20 [HTTPserver.cpp:423] HTTP server listening on port 3000
02/Nov/2014 12:55:20 [main.cpp:231] Working directory: /var/tmp/ntopng
02/Nov/2014 12:55:20 [main.cpp:233] Scripts/HTML pages directory: /usr/share/ntopng
02/Nov/2014 12:55:20 [Ntop.cpp:218] Welcome to ntopng x86_64 v.1.2.2 (r8539) - (C) 1998-14 ntop.org

The –net directive allows you to instruct ntopng to monitor all the host traffic and not just the container running ntopng.


OpenStack


OpenStack is a technology that allows to
deploy and control resources on a data
center (VMs, storage, networking). Our interest in OpenStack is manyfold:

  • Create an OpenStack VM image for enabling people to easily deploy ntop monitoring apps on datacenter.
  • Exploit ntop’s PF_RING open-source packet processing technology for bringing packets in 0-copy at 10 Gbit on a VM managed by OpenStack. This is to enable efficient traffic monitoring on a data center.

Through OpenStack we want to be able to deploy VMs with ntopng and attach them to virtual controllers (Open vSwitch) or 0-copy PF_RING ZC-based packet sources. With ZC, packets are captured in 0-copy from network adapters and deployed in 0-copy to VMs. ZC packets are deployed on the VM using virtual adapters attached dynamically to the VM though a ntop-developed kernel module based on PCI hotplug as described in this document. We have no interest, as many companies did, to accelerate Open vSwitch as for us:

  • This is just a way to communicate with the VM: nice if it’s faster, but the current Open vSwitch is good enough for carrying on activities such as flow-export or connect to the ntopng GUI via https.
  • We need to focus on what a VM can do in OpenStack, so that we can provide 10G line rate to the VM in RX and TX, with minor performance degradation with respect to the performance you can achieve on bare metal.

The good news is that we have prepared all you need to be productive immediately. If you’re an OpenStack user, we have create a VM image you can use for deploying our apps in minutes. You just need to download the OpenStack VM image, and place it onto your datacenter and create in minutes simple or complex topologies such as those depicted below.


OpenStack

OpenStackVMs


Click to view slideshow.


Final Remarks


Either you run ntop apps or PF_RING ZC on a physical machine, a container, or a OpenStack VM, we have created for you all the basic pieces you need. If you are running on a pure virtual environment, we also have the ability to monitor both your processes and your network using nProbe with Sysdig. In essence we have pre-built all you need for processing packets at high speed on both physical and virtual environments.

ntop 2015 Roadmap

$
0
0

Like every year, we have made a short-term plan for the first half 2015. As we are a research-oriented company, we plan to tackle open issues or provide better answer to existing ones. This is our short list of activities we are carrying on:

  1. 40 Gbit
    We are in the process of supporting the new Intel X710 and XL710 network adapters. They are able to operate at 10 and 40 Gbit (1 x 40 Gbit or 4 x 10 Gbit). The PF_RING ZC drivers are under development and on the PF_RING SVN you can already find a prerelease version. All our existing applications such as n2disk and nProbe will be optimised to scale to 40 Gbit.
  2. ntopng
    We have received many requests from companies that are willing to deploy ntopng but that need some extra features used in the enterprise such as ability to do traffic drill-down, advanced reporting, ability to integrate with third party apps such as Nagios, ability to perform simple active monitoring tests to be combined with existing passive monitoring facilities. In addition to this we have decided to turn ntopng into a traffic policer application that can both monitor and enforce traffic policies. For instance it can block Facebook for host Y or Skype for subnet Z, only during the afternoon. In essence we want to move ntopng to the next level similar to what happened years ago when IDSs moved towards IPSs. We have not yet decided how these features will be distributed, or if we will create a few ntopng versions. The poll is open.
  3. DDoS Mitigation
    We are working in this area since more than 6 months with a couple of selected partners. We believe that it is now time for ntop to leverage on our PF_RING ZC framework and create a software-based 1/10/40 Gbit DDoS traffic mitigator. We have a prototype working since some time, and we are refining it. It will be an open component available both as SDK (so you can embed it onto your existing application) and stand-alone application. Like many years ago we have demonstrated that commodity hardware network adapters could operate at line rate, we now want to show that it is possible to create cheap, open and simple DDoS mitigator boxes able to operate at line rate, similar to what commercial products do for a lot of bucks.
  4. Layer-7 Traffic Filtering (DPI)
    We are developing a product conceptually similar to the above DDoS mitigator, that it is able to filter application-level traffic leveraging on nDPI. It will be available both as SDK and stand-alone application and it can be used for many purposes including using it as versatile policy enforcer or as a component to be used on a pipeline. For instance you can instrument PF_RING ZC to send traffic to this component that will be put in front of n2disk. This way you can optimise n2disk disk usage by dumping only the initial bytes of selected protocols (e.g. YouTube or Netflix) that that a lot of space, or discarding encrypted traffic. These are just a few use cases.

We have many more things to tell you, but we prefer to wait until we have something you can test. Stay tuned!

Come to see the new ntopng at CeBIT 2015

$
0
0

As you might have noticed, we are busy working at ntopng. We will soon publish a blog post where we summarise the current activities and what is still missing before the next version of ntopng will be released. However we believe that while communicating through the Internet is a convenient way to reach the ntop community, we still believe that a physical meeting is also desirable. For this reason we thank our long-time partner Wuerth-Phoenix for hosting us at CeBIT Open Source Park where we can demonstrate the new ntopng at work and meet out community.

In particular if you happen to come to CeBIT on Tuesday March 17th, from 15:45 to 16:15, we will make a presentation (in English) of ntopng “High Speed Traffic Analysen mit ntop – Die Neuen Features”.

Hope to see you in Hannover!


cebit


Die von Luca Deri entwickelte Lösung als integraler Bestandteil des NetEye-Angebotes: ntop ist eine Network Traffic Lösung, die den Netzwerkgebrauch in Echtzeit anzeigt. ntop richtet sich als Webserver ein und lässt sich einfach über den Browser bedienen. Die Integration von ntop in NetEye erlaubt somit auf einfache und flexible Weise eine Überwachung und Analyse des IP Datenstroms, um so eventuelle Anomalien und Probleme jeglicher Art innerhalb des eigenen Netzwerkes festzustellen. Dafür wird mit nBox eine eigene Appliance angeboten. Die nBox ist ein Kooperationsprojekt zwischen Würth Phoenix und ntop. Würth Phoenix ist strategischer Entwicklungs- und Vertriebspartner von ntop und unterhält sehr enge Beziehungen zum Gründer Luca Deri.

How to Enforce Layer-7 Traffic Policies Using ntopng

$
0
0

ntopng has been traditionally used to passively monitoring network traffic. However as years ago  IDS (Intrusion Detection System) became mature products and eventually became IPS (Intrusion Prevention System), it was time to add inline traffic capabilities in ntopng. This post gives you s sneak preview of this new feature (still under development) that will be included in the upcoming ntopng release. The idea is to combine network traffic monitoring with traffic enforcement so that you can use ntopng not just for monitoring your users (or your children if you are on a home network) but also for making sure they don’t misuse network access with per-host/network protocol policies.

The video below shows how nDPI can be used within ntopng to enforce a specific traffic policy (in the video how to drop Skype traffic for a specific host).

In ntopng you now have the ability to specify an interface whose name is bridge:ethX,ethY (example “bridge:eth1,eth2″) that means ntopng will bridge the traffic from the two interfaces and make sure only the allowed traffic can flow across the interfaces. When using the bridge interface, ntopng shows you in the host view the list of blacklisted protocols for a given host (note that blacklist can be specified not just per-host, but also per-network or as a global policy for everyone).

Host Traffic Policy

Clicking on the “Modify Host Traffic Policy” button the form below is displayed. Here network administrators can move the supported nDPI protocols (over 170 to date and include popular protocols such as Skype, WhatsApp or YouTube) from the two lists: whitelist means that the protocol can flow, blacklist means that ntopng will drop the protocol traffic.


Layer 7 Policy Selector


If you look at the list of flows, unwanted traffic is represented with a strikethrough style (in the example below the DropBox traffic is dropped) whereas legitimate traffic is reported as usual.


Dropped Flow

This feature is implemented on top of PF_RING ZC on Linux or over pcap for non-Linux hosts (Windows and OS X for instance). This tool is designed to run non fast multicore systems as well on low-end devices such as Raspberry Pi/BeagleBoard or Ubiquity routers. Leveraging on PF_RING ZC, ntopng can operate at line rate at 1 and 10 Gbit. In the latter case it is necessary to enable RSS in the NIC (use ethtool to instruct the NIC to hash traffic based on host IPs) and open several bridge interfaces in ntopng so that it can process the various interface queues in parallel.

As previously stated this feature will be included in the next ntopng release. While the code is working reliably, we need to further polish the configuration of policies and perhaps introduce extra features such as per-host/traffic bandwidth enforcement (i.e. host X cannot send more than Y pps/Mbps). This said it won’t take too long before we release it.

Stay tuned!

Moving towards ntopng 2.0

$
0
0

As you know, our plan is to release ntopng 2.0 later this spring. While we are still coding the last missing features, we have start packaging the tool so that you can start testing it. We have decided to create two versions of ntopng:

  • Community edition: free open-source version, that you can use at no cost.
  • Professional version: fee-based version, that includes features useful in companies. Of course this version will be free of charge for educations and universities as with all other ntop commercial products.

There will also be two binary ntopng editions (you can still compile the code from source) available on the ntop packages web site:

  • Standard: x64 packages for CentOS and Ubuntu server (same as today).
  • Embedded: packages for embedded platforms such as MIPS and ARM, so that you can use them on your favourite embedded box.

All the binary packages we are building contain the pro version that can be used in community mode starting it as “ntopng –community”. If you want to test the pro version, you can mail testing@ntop.org providing the information listed here.

The list of new features is very long and counting. We will start publishing news very soon. In the meantime for all those interested in understanding the direction where we are going, I suggest you to have a look at the presentation we made this week at Cebit.


Using ntopng (pre) 2.0 on a Ubiquity EdgeRouter

$
0
0

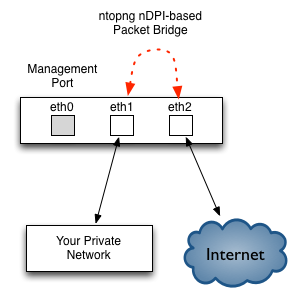
As the release of ntopng 2.0 is around the corner (we are fixing the last bugs, polishing the GUI and writing some documentation), we want to show how to turn a cheap device such as the Ubiquity EdgeRouter into a traffic monitor and layer-7 policy enforcer as depicted below.Ubiquity

NOTE: if you bridge traffic using ntopng, please make sure you do not create loops. A typical mistake is to connect eth1 and eth2 to a switch: don’t do that as otherwise a loop will be created.


Step 1: Get Your Router

Buy an Ubiquity EdgeRouter. We use the EdgeRouter Lite model (others will work too) that is cheap, and it has three Gigabit ports.


Step 2: Setup the Router

The first time you play with the router you should configure the package repositories so you can use the EdgeRouter as a embedded PC and for instance install the basic packages for compiling ntopng onto the router (in case you want to develop on it). The steps are listed below

# configure
[edit]
root@ubnt# edit system package 
[edit system package]
root@ubnt# set repository squeeze components 'main contrib non-free'
[edit system package]
root@ubnt# set repository squeeze distribution squeeze
[edit system package]
root@ubnt# set repository squeeze url http://http.us.debian.org/debian
[edit system package]
root@ubnt# 
[edit system package]
root@ubnt# set repository squeeze-security components main
[edit system package]
root@ubnt# set repository squeeze-security distribution squeeze/updates
[edit system package]
root@ubnt# set repository squeeze-security url http://security.debian.org
[edit system package]
root@ubnt# 
[edit system package]
root@ubnt# top
[edit]
root@ubnt# exit
Cannot exit: configuration modified.
Use 'exit discard' to discard the changes and exit.
[edit]
root@ubnt# commit
[ system package repository squeeze ]
Adding new entry to /etc/apt/sources.list...

[ system package repository squeeze-security ]
Adding new entry to /etc/apt/sources.list...

[edit]
root@ubnt# exit

If you want to compile ntopng you need to install the packages below (needed also at runtime if you install the ntopng binary package).

root@ubnt# apt-get install libpcap-dev libtool rrdtool librrd-dev autoconf automake autogen redis-server wget libsqlite3-dev libgeoip-dev libcurl4-openssl-dev


Step 3: Install ntopng

If you do not want to compile ntopng yourself, you can install redis-server (prerequisite for ntopng) and ntopng/ntopng-data using the packages available at the ntop packages repository. Once you have downloaded all the packages you can do:

root@ubnt# dpkg -i redis-server_2.4.15-1~bpo60+2_mips.deb 
root@ubnt# dpkg -i ntopng_1.99.150322-9208_mips.deb 
root@ubnt# dpkg -i ntopng-data_1.99.150322-9208_all.deb


Step 4: Start ntopng

If you want to use ntopng for monitoring traffic flowing on eth1, you can start it as “ntopng -i eth1“. Instead if you want to use ntopng to bridge eth1 and eth2 interfaces, you need to start it as “ntopng -i bridge:eth1,eth2″. Remember to start redis-server prior to start ntopng. If you want to make this configuration persistent you can create a file named /etc/ntopng/ntopng.conf so that you can start ntopng as a service. It is now time to connect via HTTP to http://my_ubiquity_router:3000 and enjoy ntopng.

Finally, make sure you configure ntopng to avoid using all the (little) disk space available on the device. So you should consider disabling RRD generation for hosts for instance, or refrain from dumping flows on disk (better to send them to a remote ElasticSearch instance).

ntopng Deep Dive: Interview with Ivan Pepelnjak

$
0
0

Last month Ivan Pepelnjak interviewed me on Software Gone Wild about ntop and ntopng.

The main topic of the interview were:

  • How it all started and why did Luca decide to start the ntop (and PF_RING) project?
  • What is ntopng (next-generation ntop) and why did they rewrite the product?
  • What are nprobe and nbox?
  • The distributed architecture of ntopng, including probes, data sources, collectors, and the central analyzing engine;
  • Combining ntop and elastic search;
  • Why it makes sense to convert all data into JSON format?
  • What are the problems of 40GE packet capture?
  • How can you do high-speed DDoS prevention with ntopng?

You can read the whole interview and listen to the podcast . Be prepared as there will be a part II on PF_RING.

PF_RING 6.0.3 Just Released

$
0
0

Today we have released PF_RING 6.0.3,  a maintenance release that includes many fixes and small changes. The release changelog is listed below.

  • PF_RING Library
    • New pfring_open() flag PF_RING_USERSPACE_BPF to force userspace BPF instead of in-kernel BPF with standard drivers
    • New API pfring_get_card_settings() to read max packet length and NIC rx/tx ring size
    • New Napatech support
    • Support for up to 64 channels with standard drivers, pfring_set_channel_mask() has a 64bit channel mask parameter now
    • Reworked IPv6 parsing
    • Configure parameter –disable-numa to remove libnuma dependency
    • ARM fixes
    • Minor bpf memory leak fix
  • ZC Library
    • New pfring_zc_open_device() flag PF_RING_ZC_DEVICE_SW_TIMESTAMP to force sw timestamp
    • New API pfring_zc_get_queue_id() to read SPSC queue ID or interface index
    • New DAQ module for ZC
    • pfring_zc_send() is now returning errno=EMSGSIZE on packet too long
    • Fix for receiving packets from stack using
    • Fix for send_pkt_burst() with IPC SPSC queues
    • Fix for drop stats when using SPSC queues over the standard pf_ring API
    • Fix for /proc stats in IPC mode when using the standard pf_ring API
    • Fix for packet timestamp when using SPSC queues over the standard pf_ring API
    • Fix for stats when inter-process SPSC queues are used
  • PF_RING-aware Libpcap
    • New PF_RING-aware libpcap v.1.6.2
    • New .npcap (compressed pcap) files support
    • Fix for libpcap over ZC, reworked poll support
  • PF_RING kernel module
    • New eth_type field in kernel filters
    • Reworked BPF support
    • Polling Mode/Breed under /proc is now “ZC” for ZC devices (in place of DNA)
    • Increased max dev name size
    • transparent_mode is now deprecated
    • Fix for ‘any’ device
    • Fix for kernel >=3.19
    • Fix for hw vlan strip in case of multiple sockets on the same device (standard drivers)
    • Fix for kernel Oops (rx vlan offload check)
  • PF_RING-aware/ZC Drivers
    • New Intel i40e (X710/XL710) ZC drivers
    • New ixgbe ZC driver v.3.22.3
    • ixgbe poll fix
    • Fixes for Centos/RH 6.6
    • Fixes for kernel >=3.16
  • Examples
    • New zbalance_DC_ipc: a master process balancing packets to multiple consumer processes,
      using multiple threads for packet filtering in a Divide-and-Conquer fashion,
      with an optional stage for sorting filtered packets before distribution
    • New zreplicator: example application receiving packets from n ingress interfaces and replicating them to m egress interfaces
    • pfcount: -N parameter to exit after reading packets
    • zsend:
      • IPC support to attach to an external cluster/queue
      • added -P to use pulse-time thread for tx rate control
      • added -Q to enable VM support (to attach a consumer running in a VM)
    • zbalance_ipc:
      • ability to create ingress sw queues (instead of opening interfaces) with -i Q (comma-separated list of Q and interfaces is allowed)
      • added daemon mode
      • added pid file
      • proc stats fix
      • interface and per-queue stats with -p
    • pflatency:
      • added -o and -c
      • max/min/avg stats
    • zfifo fixes

PF_RING Deep Dive: Interview with Ivan Pepelnjak

$
0
0

In late March, Ivan Pepelnjak interviewed me on Software Gone Wild about ntop and ntopng, and in a second interview about PF_RING.

The main topic of the second interview have been:

  • What is the difference between PF_RING and the Linux built-in packet capturing module;
  • How can you process over 10 million packets per second per CPU core?
  • Do you need special device drivers for PF_RING or can you use the standard Linux NIC drivers?
  • How does a packet processing application interact with the PF_RING library?
  • How do you spread packets across multiple cores, multiple copies of monitoring application, or even multiple monitoring applications?

You can read the whole interview and listen to the podcast. Enjoy!


Do you want to work for ntop?

$
0
0

As ntop software is increasing in popularity, we need help for supporting our users and working at new developments. Therefore we are looking for someone to join our development time, help us, and assist the user community.


Job Description


We are looking for a candidate located in Italy/Switzerland or in a similar time zone (CET) willing to work remotely or (better) at our main locations (Pisa, Amsterdam). We offer semi-flexible working hours with a set of time to be allocated every day Mon-Fri during standard working hours (9 AM – 6 PM).

Candidates will be trained, and integrated in the ntop team. We are looking for people interested in networking willing to learn personally and serve the community.


Tasks


  • Support users on the mailing lists and direct customers.
  • Help with troubleshooting and bug fixing.
  • Provide advice on how to use ntop software.
  • Assist improving the documentation such as wiki and manuals.
  • Develop open-source networking software.
  • Assist improving the documentation including wiki and manuals.
  • Development of new functionality, products and components.


Job Requirements


  • Good English writing and communication skills.
  • Interested in high-speed networking in general and happy of working in this problem domain.
  • Ability to program in C/C++/JavaScript. Lua is a plus.
  • Good knowledge of Linux.
  • Knowledge of popular network troubleshooting tools such as Wireshark and tcpdump.

Preference will be given to users that:

  • Experienced with ntop tools and applications.
  • Knowledge of popular open-source network monitoring applications (e.g. Nagios, Bro, Snort and Suricata).
  • Linux kernel network programming.


Compensation


Monthly payments at the end of the month. Salary will vary according to experience. Part of the company revenues will be paid as individual bonus (i.e. ntop also belongs to you).


How to Apply


If you believe you’re the right person, please send a mail to jobs@ntop.org and include:

  • Explain why you are interested in this position.
  • Describe your past experience, and professional goals.
  • Your timezone, location and available working hours.
  • Salary expectations.
Viewing all 544 articles
Browse latest View live