Quantcast
Channel: ntop
Viewing all 544 articles
Browse latest View live

Running nProbe and ntopng on Ubiquity EdgeRouter Lite

$
0
0

On this blow we have already discussed on how to compile and run ntopng and nProbe on a BeagleBoard and Raspberry Pi. Now we explain (courtesy of  Shane Graham) how to achieve the same on a Ubiquity EdgeRouter Lite, a cheap yet powerful router.

First, setup the proper Debian repository:

configure
set system package repository squeeze components 'main contrib non-free'
set system package repository squeeze distribution squeeze
set system package repository squeeze url http://http.us.debian.org/debian
set system package repository squeeze-security components main
set system package repository squeeze-security distribution squeeze/updates
set system package repository squeeze-security url http://security.debian.org
commit
save
exit

Install the prerequisites for compiling nProbe:

sudo apt-get update
sudo apt-get install build-essential libtool automake autoconf

Prepare to compile:

tar zxvf nprobe_6.15.131104_svn3774.tgz
cd nprobe_6.15.131104_svn3774

Compile and install:

./autogen.sh
 make
 make dat files
 sudo make install

You can now run nProbe or compile ntopng the same way.  The platform is quite efficient and nProbe uses very little CPU cycles, much lower than other processes such as Squid used for URL monitoring.

Enjoy!


Scripting ntopng with Lua

$
0
0

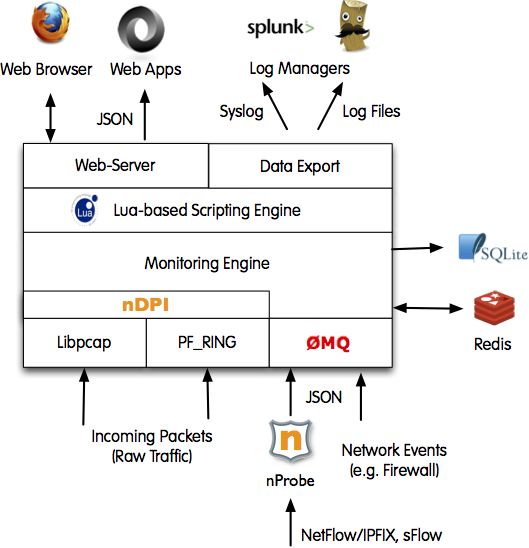
The ntopng architecture is divided in three layers:

  • Ingress layer (flow or packet capture).
  • Monitoring engine: the ntopng core.
  • Lua scripting engine
  • Data export layer (via web, syslog or log files).

ntopng

Thanks to the scripting engine, ntopng is fully scriptable. This means that via Lua you can extract the monitoring information and report it into HTML pages or export it to third party applications. The ntopng Lua API is pretty simple it consists of two classes, ntop and interface. ntopng also comes with some example scripts that highlight the main API functionalities, although the best demo is perhaps the ntopng web interface. The embedded HTTP(S) web server is responsible for parsing GET/POST parameters (if any) and places them into the _GET global scripts variable so that they can be accessed from Lua. Scripts are also used in ntopng to execute periodic actions such as dumping throughput and top talkers to disk. ntopng is fully reentrant thus means that multiple scripts can be safely executed simultaneously.

An example of Lua scripting is the following.

--
-- (C) 2013 - ntop.org
--
dirs = ntop.getDirs()
package.path = dirs.installdir .. "/scripts/lua/modules/?.lua;" .. package.path

require "lua_utils"

sendHTTPHeader('text/html')

interface.find(ifname)
ifstats = interface.getStats()

type = _GET["type"]

if((type == nil) or (type == "size")) then
what = ifstats["pktSizeDistribution"]
end

local pkt_distribution = {
['upTo64'] = '<= 64',
['upTo128'] = '64 <= 128',
['upTo256'] = '128 <= 256',
['upTo512'] = '256 <= 512',
['upTo1024'] = '512 <= 1024',
['upTo1518'] = '1024 <= 1518',
['upTo2500'] = '1518 <= 2500',
['upTo6500'] = '2500 <= 6500',
['upTo9000'] = '6500 <= 9000', ['above9000'] = '> 9000'
}

tot = 0
for key, value in pairs(what) do
tot = tot + value
end

threshold = (tot * 5) / 100

print "[\n"
num = 0
sum = 0
for key, value in pairs(what) do
if(value > threshold) then
if(num > 0) then
print ",\n"
end

print("\t { \"label\": \"" .. pkt_distribution[key] .."\", \"value\": ".. value .." }")
num = num + 1
sum = sum + value
end
end

if(sum < tot) then
print("\t, { \"label\": \"Other\", \"value\": ".. (tot-sum) .." }")
end

print "\n]"

In bold the API calls are highlighted. ntopng transparently handles the redirection of the output into web pages, and mix of HTML with Lua code similar to what happens with other scripting languages such as PHP. Developers familiar with web scripting languages should become familiar with ntopng pretty quickly and thus extend and customise it without much hassle.

Please make sure that you share your scripts with the ntopng community.

Learning the PF_RING API

$
0
0

Since the initial version, PF_RING has supported the pcap API that is familiar to many developers. This has allowed people to seamlessly port existing apps on top of PF_RING, simply relinking their apps using the PF_RING-aware version of libpcap. Unfortunately the pcap API is able to exploit just a subset of the features available in the native PF_RING API as demonstrated by the various apps we have coded to show how to the native API works.

In order to ease the development of new native PF_RING applications, we acknowledge it was time to properly document the API. In particular those functions that are part of  DNA and libzero. For this reason, we have created an HTML documentation of the API that describes not just the functions but also all the various datatypes. We hope this will enable the development of new native applications.

This said we have just released PF_RING 5.6.2, the last before the major revision 6.x that we will start rolling out in a few weeks. Beside the addition of many new features, on 6.x we have cleaned the API that in 5.x is a bit “fragmented” in “classic” PF_RING, DNA and libzero. In the new version everything will be easy and smooth. We believe you will appreciate hoping that this will further ease the development of new native applications.

How to Balance (Mobile) Traffic Across Applications Using PF_RING

$
0
0

Traffic monitoring requires packets to be received and processed in a coherent matter. Some people are lucky enough to get all interesting packet on a single interface, but this is unfortunately not a common scenario anymore:

  • The use of network taps split one full-duplex interface into two half-duplex interfaces each receiving a direction of the traffic.
  • Standby interfaces, require traffic monitoring apps to surveil two interfaces, where traffic flows only on one interface at time.
  • Asymmetric traffic (i.e. all protocols similar to HTTP where the traffic in one direction is much more than the traffic on the opposite direction).

On top of these scenarios, there are some more that are bait more challenging:

  • Balance encapsulated traffic (i.e. IP tunnels or mobile traffic encapsulated in GTP) using the encapsulated IP or tunnel identifier.
  • Merge and then balance traffic received on multiple ingress interfaces. Eventually after merging, forward the traffic onto an egress interface.
  • Send the same ingress packet to various applications:
    • Some of which need to perform complex monitoring (e.g. nProbe with nDPI and various plugins enabled) and thus need the packet to be balanced across a pool of applications.
    • Others require packets in the same order as they have been received on the ingress interfaces (i.e. First-In-First-Out based on the ingress interfaces arrival time) and need to be strictly processed in order (e.g. n2disk that needs to dump packets on disk).

The “classic” PF_RING contains the concept of cluster. A set of applications sharing the same clusterId (e.g. 10) will balance ingress packets coming from one or more ingress interfaces. For instance take the pfcount application that receives and counts ingress packets, and suppose you want to balance traffic coming from eth1 and eth2 to three pfcount applications, then you need to start three times (this because you decided to have 3 apps, but if you need more apps, you just have to start more) the following commands:

  • pfcount -i “eth1,eth2″ -c 10 -g 0
  • pfcount -i “eth1,eth2″ -c 10 -g 1
  • pfcount -i “eth1,eth2″ -c 10 -g 2

In essence you start multiple instances of the same application on the same clusterId (the only difference is the -g parameter that binds a specific instance to the specified CPU core). This mechanism is available also on the PF_RING DAQ for Snort that enables multiple Snort instances to share ingress traffic. Note that the PF_RING cluster:

  • Balances the traffic according to the flow (i.e. the same application sees both directions of the same connection), but you are free to set a different traffic balancing policy if you want (see pfring_set_cluster() in the PF_RING API).
  • It is GTP-friendly, so it can effectively balance ingress traffic across multiple GTP-aware applications such as nProbe.

Using DNA and libzero, we can have an even more versatile and efficient traffic balancing. As described in README.libzero, the pfdnacluster_master application implements a very versatile traffic balancing as depicted below.

DNAMasterAs shown above, it is possible to both balance and fan-out in zero copy (read as: you can handle 2x10G interfaces with no packet drop whatsoever) to multiple applications in a very versatile manner. For example the balancing depicted above is implemented with the following commands:

  • pfdnacluster_master -i “dna0,dna1,dna2″ -c 10 -n 3,1,1 -r 0
  • nprobe -i dnacluster:10@0 -g 1
  • nprobe -i dnacluster:10@1 -g 2
  • nprobe -i dnacluster:10@2 -g 3
  • n2disk -i dnacluster:10@3  ….
  • other_app -i dnacluster:10@4 …

In essence in pfdnacluster_master the -n parameter is a comma separated list of numbers, where:

  • If the number is 1 it means that the aggregation of  the ingress traffic is sent in zero-copy to this application. All the traffic, no balancing.
  • If the number is greater than 1, then the traffic is balanced across the consumer applications.

For mobile, GTP-encapsulated traffic, we have developed a more versatile application named DNALoadBalancer.

# ./DNALoadBalancer -h
Usage:
DNABalancer [-h][-d][-a][-q] -c <id> -i <device>
[-n <num app> | -o <devices>] [-f <path>]
[-l <path>] [-p <path>] [-t <level>]
[-g <core_id>]

-h             | Help
-c <id>        | Cluster id
-i <devices>   | Capture device names (comma-separated list) [Default: dna0]
-n <num app>   | Max number of slave applications (max 32) [Default: 1]
-o <devices>   | Egress device names (comma-separated list) for balancing packets across interfaces
-m <dissector> | Dissector to enable:
               | 0 - n-tuple [Default]
               | 1 - GTP+RADIUS 
               | 2 - GRE 
-q             | Drop non GTP traffic (valid for GTP dissector only)
-r             | Reserve first application for signaling only
-s <type>      | n-Tuple type used by the hash algorithm:
               | 0 - <Src IP, Dst IP> [Default]
               | 1 - <Src IP, Dst IP, Src Port, Dst Port, Proto, VLAN>
               | 2 - <Src IP, Dst IP, Src Port, Dst Port, Proto, VLAN> with TCP, <Src IP, Dst IP> otherwise
-u <mode>      | Behaviour with tunnels:
               | 0 - Hash on tunnel content [Default]
               | 1 - Hash on tunnel ID
               | 2 - Hash on outer headers
-d             | Run as a daemon
-l <path>      | Log file path
-p <path>      | PID file path [Default: /tmp/dna_balancer.pid]
-t <level>     | Trace level (0..6) [Default: 0]
-g <core_id>   | Bind to a core
-a             | Active packet wait

Example:
DNABalancer -i 'dna0,dna1' -c 5 -n 4

As shown in the application help, it implements a versatile dissector (-m) for tunnelled traffic (GTP and GRE), has the ability to drop non-encapsulated traffic (-q) so we can ignore if necessary, non-interesting messages, and decide how to handle tunnelled balancing (-u).

In essence as long as you have enough cores on your system to allocate to the balancer, you can avoid purchasing costly yet not-so-versatile traffic balancers. As we release the source code of apps such as the pfdnacluster_master, you can change your traffic balancing policies the way you want/like without relying on any hardware traffic balancer manufacturer. Nice and cheap, isn’t it?

Using n2n with Amazon (AWS) EC2

$
0
0

Although we currently have no time to further develop n2n (we have put the project on hold until we have time to work at it again), this tool is still widely used. This article (courtesy of Stuart Buckell) shows how to use n2n to enable broadcast and multicast support on Amazon (AWS) EC2, which is required for certain enterprise applications and protocols.

Enjoy!

Napatech and ntop will demonstrate 10 Gbps capture-to-disk at RSA and MWC

$
0
0

Napatech, the world’s leading supplier of network analysis adapters, and ntop, the renowned traffic monitoring software expert, today announced a collaboration focused on accelerating time to market for high-performance network management and security appliances. The first initiative is a 10 Gbps capture-to-disk solution that will be demonstrated at Mobile World Congress and RSA, February 24-28.

  • Capture-to-disk is fast becoming a critical capability for appliances used in network management and security as well as real-time big data analytics, but it requires expertise to implement, especially for high-speed applications.
  • Commercial-off-the-shelf (COTS) servers offer appliance vendors higher performance analysis equipment with shorter development cycles using fewer resources.

Napatech adapters are the de-facto standard for high-performance appliance development with guaranteed delivery of data for analysis.

  • ntop is renowned for accelerating traffic monitoring applications with ntop PF_RING™, a recognized and widely used interface for network analysis application development in both commercial and open-source communities. PF_RING features on-the-fly packet indexing, which speeds up packet display and filtering.
  • Napatech analysis adapters and ntop software provide appliance vendors with a reliable platform that accelerates implementation of appliances for monitoring, testing, securing and optimizing networks.

Napatech and ntop will demonstrate their 10 Gbps capture-to-disk solution at:

  • Mobile World Congress at booths 6K20 and 6B50 in Barcelona, Feb. 24-27.
  • RSA at booth 1932 in San Francisco, Feb. 24-28.

References

Introducing nProbe Splunk App for (Free) Network and Application Monitoring

$
0
0

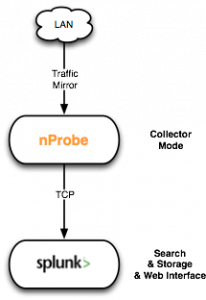
Splunk is a popular realtime data capture, aggregation, and data visualisation system. Designed initially for handling application logs, in its current version is available  with a free enterprise license can index up to 500 megabytes of data per day. We have decided to use Splunk to capture and index in realtime flows generated by nProbe, and in particular those that contain non-numerical information, such as HTTP URLs for instance. The versatile of splunk is such that it can be easily customised with a few mouse clicks, so that new reports, views and triggers can be created in second. Hence we have create a free nProbe Splunk Application (released under GPLv3 and platform independent so you can run it for instance on Linux, Windows or MAC OSX) that you can use as graphical monitoring console for nProbe. All details are explained in the nProbe Splunk QuickStart Guide, but the impatient can read this quick short guide:

  • You need nProbe 6.16 or newer, that you can use as flow probe and/or collector. nProbe will send splunk flow information (in essence nProbe is a flow producer and splunk a flow collector) formatted in JSON. For instance you can start nProbe as follows (note the –tcp <host>:<port> that specified the Splunk host collection port implemented by the nProbe-Splunk App)
    nprobe -T “%IPV4_SRC_ADDR %L4_SRC_PORT %IPV4_DST_ADDR %L4_DST_PORT %PROTOCOL %IN_BYTES %OUT_BYTES %FIRST_SWITCHED %LAST_SWITCHED %HTTP_SITE %HTTP_RET_CODE %IN_PKTS %OUT_PKTS %IP_PROTOCOL_VERSION %APPLICATION_ID %L7_PROTO_NAME %ICMP_TYPE” –tcp “127.0.0.1:3333″ -b 2 -i eth0 –json-labels
  • Splunk ArchitectureVia the nProbe Splunk app we have developed, Splunk will start receiving flows and index them in realtime.
  • The nProbe Splunk application will then start populating the defined reports as depicted in the image gallery below.

Click to view slideshow.


The reports we created, in addition to “classic” host/traffic information (top hosts, top application protocols [via nDPI] etc.), allow for instance to depict the top HTTP sites accessed, the mime-types or return code. As manipulating text is one of the things Splunk does well (usually flow-collectors are good with IPs and ports but not with text), you don’t have to be afraid to use the application for creating custom reports based on text. We have implemented HTML reports, but nothing prevents you from creating similar reports for VoIP, email or mobile traffic (e.g. top IMSI or APN). nProbe (via the new –tcp command line flag and its revamped JSON engine) can export all plugin information to splunk, and you can create your own reports in a few clicks using the application we developed.

As we are giving away for free the Splunk application, we hope that users will contribute to it and send us patches so that we can make them available to the whole community. Many thanks to our colleague Filippo for leading this project.

Enjoy!

Accurate 10 Gbit Traffic Reply Using disk2n

$
0
0

n2disk is a software application that allows to dump traffic to disk at line rate (10 Gbit full duplex) with high-accurate timestamps. This both using networks cards featuring hardware timestamps and also with software timestamps. Most companies focus just on capture to disk, whereas we believe that it is also compulsory  to provide solutions for traffic replay by exploiting these high-accurate timestamps that have been saved on pcap files. This activity is quite challenging. Replying traffic with high-precision timestamps it is necessary for instance whenever we want to reproduce exactly the same network conditions as observed during packet capture. Application such as pfsend can replay pcap files but the tool is limited in pcap size (the pcap file cannot exceed the available system memory) and accuracy (i.e. the transmit rate has good precision but it is not 100% accurate).

Together with Fox Television, we have developed a new application named disk2n (in essence the n2disk counterparts) able to reproduce pcap-saved network traffic using commodity hardware (an Intel 10 Gbit NIC using PF_RING DNA) at very high-precision. Demonstrated at various events [1] [2], disk2n has been used to reproduce UHDTV traffic captured by n2disk onto a live network. In this context, traffic replay speed is important but it must also be combined with high-accuracy as ultra-HD television cannot tolerate any jitter otherwise the video will flicker.

After many tests and improvements, we are now announcing the availability of disk2n to everyone who needs to:

  • Reproduce large amount (Terabytes) of traffic previously captured in the industrial format pcap format (e.g. using n2disk). The pcap file to reproduce can be larger of the available system memory and it can be portioned onto several smaller pcap files.
  • High-accuracy traffic reproduction so that replayed traffic is sent at the same pace of the captured traffic.
  • Using commodity hardware and PF_RING DNA.

For more information about this new product, please refer to the disk2n product page.


Introducing PF_RING ZC (Zero Copy)

$
0
0

After almost 18 months of development, we are pleased to announce the release of PF_RING ZC (Zero Copy). Based on the lessons learnt with DNA and libzero, we have decided to redesign from scratch a new consistent zero-copy API that implements popular network patterns. The goal is to offer you a simple API, able to deliver line-rate performance (from 1 to multi-10 Gbit) to network application developers. We have hidden you all the internals and low-level details, in order to create a developer-centric API rather than a network/hardware-centric API.

For those familiar with DNA and Libzero, the main differences of ZC with respect to them are:

  1. We have unified the drivers for both in-kernel (former PF_RING-aware drivers) and kernel-bypass (former DNA) drivers. Now you can open the same device as “-i eth0″ (in-kernel processing) and as “-i zc:eth0″ (kernel bypass). In essence you decide at runtime what operating mode you want to use.
  2. All drivers memory is mapped in huge-pages for better performance.
  3. All operations are performed in zero-copy if you open the device as “zc:ethX”. You see that very easily doing this simple test (eth3 is a 10 Gbit interface running the PF_RING-aware ixgbe driver). The first command is able to send 0.82 Gbit, the second 10 Gbit.
    1. # ./zsend -i eth3 -c 3 -g 0
    2. # ./zsend -i zc:eth3 -c 3 -g 0
  4. ZC is KVM friendly, meaning that you can send/receive packets from applications and threads running on a VM (Virtual Machine) at 10 Gbit line rate, without using techniques such as PCIe passthrough. Note that the same application can run unchanged, both in the VM and the physical host: we’re really VM friendly with ZC.
  5. Similar to other network frameworks such as the Click Modular Router, we offer simple components such as queue, pool, worker, for creating applications in a few lines of code.
  6. The API has been simplified and rewritten. For instance with as low as 6 lines of code you can create a traffic aggregator and balancer (see examples).
  7. When operating in kernel-bypass, we allow you to interact with the IP stack and send packets from/to it. This will ease development of applications that need to operate at line rate but that sometimes need to interact with the host IP stack.
  8. We can operate in one-copy-mode when interacting with low-speed devices (e.g. WiFi adapters) or for allowing NICs for which we do not offer accelerate drivers for, to benefit of the ZC too: there is just one copy when the packet enters ZC, and nothing else.
  9. For no-for-profit people and research, we offer our products free of charge. For commercial customers, we have simplified the licensing model, so that there is just one license (and not two as before, one for DNA and one for Libzero, so in essence you now pay a lower license fee)
  10. We want this technology to be pervasive, so you need a license only for accelerated drivers, whereas for all the rest (e.g. KVM and one-copy support) you can use it for free with no license needed.

If you want to test PF_RING ZC, the best you can do is to read this quick start guide to be productive in a matter of minutes.

FAQ


Q. What is the PF_RING ZC performance?
A. Line rate, any packet size, multi 10 Gbit. Just try it yourself using apps such as zcount and zsend.

Q. Will you still support DNA and Libzero?
A. For the time being we will continue to support DNA/Libzero although the future is PF_RING ZC as it offers several new features and a consistent API.

Q. Does PF_RING ZC support legacy applications such as those based on libpcap?
A. Yes, similar to its predecessor DNA, we support pcap-based applications as well other apps such as Snort via PF_RING DAQ.

Q. How do I open a queue from PF_RING ZC/libpcap?
A. You can use the syntax “zc:<clusterId>@<queueId>”. Example: pcount -i zc:4@0

Q. What adapters feature native ZC drivers?
A. We currently support Intel adapters (1 and 10 Gbit) in zero-copy mode, and all other adapters in 1-copy mode. Remember that as soon as the packets have been moved to the ZC world, you can pass them in zero-copy to an arbitrary number of applications, threads and VMs. In essence you pay the copy ticket just at the entrance.

Q. How do you position ZC with respect to other technologies such as DPDK?
A. DPDK is designed for developers who are designing applications close to the hardware, who know in detail the X86 architecture, who are willing to call network interfaces with hex PCI ID (eg. 0d:01.0). With PF_RING ZC, devices are called with their name (e.g. eth1), PF_RING ZC manages all the low-level details, as you can run you existing pcap-based apps with no headaches. ZC is a developer-friendly technology.

Migrating from DNA/Libzero to PF_RING ZC

$
0
0

Since the introduction of PF_RING ZC (Zero Copy), we have received many inquiries about migrating from DNA/LibZero to ZC. Said that at the moment we do not plan to discontinue DNA/LibZero, we would like to summarise the differences and ease you the migration:

  • In PF_RING 5.x (pre-ZC) there were two driver families: DNA-drivers and PF_RING-aware drivers. With the former you could operate at line-rate with DNA/LibZero, with the latter the speed was limited and you were not able to use the packets from LibZero. In ZC, there is one driver family named PF_RING-aware driver (new generation).
  • In ZC you can operate in two modes: zero-copy and one-copy mode. In zero-copy you have in essence the same model supported by DNA (packets do not pass throughout the kernel and are read by apps in zero-copy), whereas in one-copy mode the packets pass through the PF_RING kernel module, so there is one copy involved (as well as the overhead of the kernel).
  • Like in DNA, ZC PF_RING-aware drivers support zero-copy only for Intel-based interfaces. This does not mean that our technology is Intel-only, and we do not exclude to have non-Intel drivers in zero-copy in the future.
  • Contrary to DNA drivers that renamed the interfaces to dnaX, the interface name does not change (e.g. it is still eth1) so that you can do standard networking with it (ping, SSH and so on).  Supposing to use a ZC PF_RING-aware driver, at runtime you can open the interface with its name (e.g. eth1) for using it in one-copy mode, or open it as zc:eth1 for using it in zero-copy mode. Remember that if you plan to use the interface with ZC, you need to configure your huge-pages first as explained in this README.
  • With ZC you can distribute, balance, fan-out, process from VMs packets in zero-copy and thus at 10 Gbit line rate. This regardless if you have captured the packets from a ZC device, from a one-copy device, or if you have created the packet yourself.
  • If you have an old PF_RING-based application (i.e. if you did not use the libzero API at all), moving to ZC means 1) setup the huge-pages and 2) use zc:ethX instead of dnaX. That’s all.
  • If your application used the old LibZero API, either you continue using the legacy DNA drivers and the LibZero API, or you need to replace the LibZero API with the ZC API as shown in the demo applications we have created.
  • If your application is a simple receive-and-process application, you probably do not need to use the ZC API. Instead you will need it if you plan to distribute packets across applications and threads, or receive them on a host and process them on a virtual-machine.
  • As described in this README, with ZC you can decide at any time to receive packets in zero-copy and inject them on the IP stack or vice-versa.
  • Unless you are a no-profit or research institution to which we offer our commercial products free-of-charge, with ZC you need to pay us a license only if you use our zero-copy drivers. There is no license needed for the one-copy drivers, ZC API, or zero-copy to VM.

Not All Servers Are Alike (With PF_RING ZC/DNA) – Part 3

$
0
0

We have already discussed on the first and second part of this post some common issues that might be encountered while doing high-performance packet processing. Most of the problems are related to multi-CPU servers (NUMA) and memory configuration. We have spent a lot of time creating the nBox web-GUI that is not just a graphical interface, but it is a way to automatically configure ntop applications as well report common configuration issues. For those who want to live without it, we have some additional lessons learnt to share.

Lesson 1: Make sure all your memory channels are populated


Every CPU has a number of memory channels that influence the memory bandwidth available to applications. Although most people look only at the total memory (or at most at memory type), it is very important how you populate the memory slots. Using

cat /proc/cpuinfo | grep "model name" | head -1
model name: Intel(R) Xeon(R) CPU E5-2667 0 @ 2.90GHz

You can figure out the CPU you own (Xeon E5-2667 in the above case), and then going to http://ark.intel.com and searching for the CPU model, you can learn the number of channels the CPU has. In our case it has 4 memory channels, so we need to make sure that 4 channels per CPU (in case you have a NUMA system with more than one CPU) have been populated.

Using:

# dmidecode |grep "Speed:\|Locator:"|grep -v Bank

you can see what slots are populated. In the example below the first slot (on the first CPU slot 1) is NOT populated, whereas the second  (on the second CPU slot 9) is populated.

Locator: PROC  1 DIMM  1 
Speed: Unknown
Configured Clock Speed: Unknown
Locator: PROC  2 DIMM  9 
Speed: 1600 MHz
Configured Clock Speed: 1600 MHz

Note that depending on the motherboard there is an exact sequence you need to populate, but in general the first slots need to be populated. So in our case as we have 4 channels, we must make sure that each CPU has the first 4 memory slots filled in. Again it does not matter just the total amount of memory, but how you populated the slots. So 1 bank of 16 GB is not the same as 4 banks each of 4G, as in the first case only one channel would be used whereas in the latter all 4 channels will be.

Of course the type of memory (dual rank etc.) and clock (the faster the better) is also important. There are tools such as stream you can use to measure the real available bandwidth on your system.


Lesson 2: Plug your NICs on the correct NUMA node


As you know, on NUMA systems you must avoid crossing the costly QPI bus so that your apps must be bound to a precise NUMA node. The same applies to PCIe slots. On NUMA systems each node has some PCIe slots directly connected. So if your application runs on such node, you must make sure that such app is accessing packets received from a NIC connected to such node. Supposing you want to know the node to which eth1 is attached you need to do

# cat /sys/bus/pci/devices/`ethtool -i eth1 | grep bus-info | cut -d ' ' -f 2`/numa_node
1

or you can use the command

# hwloc-info -v

that is a bit more verbose but that provides more detailed information.

This means that applications opening the device zc:eth1 must run on NUMA node 1 as otherwise they will have to cross QPI for each and every packet. Note that there is no software command you can use to change NIC affinity, as this is a physical/electrical property. If you want to change node you need to change PCIe slot.

Please note that for dual-port (or even denser) NICs, both ports are on the same NUMA node, so if you want to have one NUMA node taking care of one NIC, you must buy two single-port NICs and install them on a different node.


Lesson 3: Allocate the memory and bind your application on the correct NUMA node


Once you have selected the NUMA node to use and made sure your NIC is properly installed, it is now time to allocate the memory properly. First of all you need to load the driver telling to what cores the memory should be bound. In our DNA and ZC drivers you will find a new option named numa_cpu_affinity, that allows you to specify for each NIC port to what core (not NUMA node, but core) the port will be bound to. In essence the core identifies what NUMA node will then use the NIC. Example with

insmod ./ixgbe.ko numa_cpu_affinity=0,0,1,1

the first two ports will be used by core 0, the second two by core 1. Note that it is not strictly necessary to specify the exact coreId but it must be clear that the coreId is used to figure out the NUMA mode the core is running on, and thus the memory affinity.

Once the driver memory has been properly allocated, we need to start the application on the exact node. In order to do that, you must first bind your app to the correct node and then allocate memory and spawn threads. In fact if you start your app, open your PF_RING ring and then bind it to the correct node, you have not done a great job. This because the application might have allocated the memory on the wrong node and then you have set the affinity too late. Please pay attention to this fact that is not a minor detail at all.

If you want to find out what cores are bound to that NUMA node do:

# numactl --hardware 
available: 2 nodes (0-1)
node 0 cpus: 0 1 2 3 4 5 12 13 14 15 16 17
node 0 size: 32733 MB
node 0 free: 722 MB
node 1 cpus: 6 7 8 9 10 11 18 19 20 21 22 23
node 1 size: 32767 MB
node 1 free: 1375 MB

Lesson 4: RAID controller and NICs must be connected to the same NUMA node


If you have decided to use applications like n2disk to dump traffic to disk, there is an extra thing to check. You must make sure that:

  1. the RAID controller you are using to dump packets to disk
  2. the NIC from which you are capturing traffic
  3. n2disk

are all bound/connected to the same NUMA node. A common mistake is to forget about the RAID controller that can degrade the overall performance although packet capture  is running at full speed.


Conclusion


NUMA might not be your best friend if you expect the OS to do everything on your behalf. There are some things you must do yourself (e.g. PCI slot selection) and others that can be done on software. Make sure you have everything properly configured, before starting to do performance measurements on your application.
 

Introducing on-the-fly 10 Gbit pcap compression on n2disk

$
0
0

Compressing pcap produced by n2disk is a good idea for a few reasons:

  1. It allows disk space to be saved as compressed data takes less space on disk.
  2. It enables the creation of cheaper packet recorder appliances as with the same hardware you can save more data onto disk and thus in some problem domain you can double the capacity of your existing box.
  3. As n2disk leaves some space in CPU cycles (in particular when used on top of Napatech adapters) we have room to compress and index packets on-the-fly at 10 Gbit, without dropping a byte.

As many of you know, lossless data compression works based on the assumption that on data there are sequences of repeating characters that can be replaced with only one sequence. This means that in order to compress data n2disk has to buffer some packets (~ 1 MB) and then compress them in chunks (i.e. we don’t compress packet-by-packet). Due to compression, file is not anymore in pcap format (we use the .npcap file extension), the internal format is still pcap but it is compressed, similar to what you can do with gzip when you compress a pcap file. The advantage with .npcap files with respect to .pcap.gz is that it is compressed in 1 MB chunks and thus if we want to extract (e.g. using the index generated by n2disk) a few packets, we can can decompress only the chunks that contain them instead of decompressing the whole file that is pretty time consuming (remember that at 10 Gbit, every second you produce 1.25 GB of data).

In order to support compression, we have revamped all the n2disk companion tools so that they can search, extract, decompress n2disk compressed files. On the nBox interface you will not see any difference between a compressed pcap or an uncompressed one, as everything is handled transparently. The only difference is that you save space on disk.

We want to repeat that pcap compression is an activity performed by n2disk:

  1. During packet capture (not not in post-processing).
  2. Packet compression and indexing happen simultaneously during capture.
  3. Pcap indexes are always saved in compressed format, whereas you can choose if you want to dump uncompressed (plain .pcap files) or compressed (.npcap) files.
  4. Packet compression does not degrade the performance as n2disk can still dump to disk traffic at line rate 10 Gbit (64 bytes packets) or at 2 x 10 Gbit if your storage subsystem is adequate.

Said that pcap compression will not affect your capture performance, let’s now see what is the compression ratio you can expect. For our tests we have used the following setup:

  1. Intel(R) Xeon(R) CPU E5-2643 v2 @ 3.50GHz
  2. RAM 4 x 8GB 1600Mhz
  3. 8 x 10K RPM HDD with hardware RAID controller.
Traffic Type Speed
(Gbps)
Packets
(Mpps)
Space
Save
Command Line Used
(Compression + Indexing)
Synthetic
(pfsend)
10 Gbit 14.88 Mpps 95% n2disk10g -i dna0 -o /storage/n2disk/dna0/ -b 4096 -C 4096 -p 1024 -g -s 1518 -M -I -Z -S 0 -c 1 -z 2 -w 3 -m 100 -n 50 -H -A /storage/n2disk/dna0/timeline
High Frequency Trading 10 Gbit 9.62 Mpps 82% n2disk10g -i dna0 -o /storage/n2disk/dna0/ -b 4096 -C 4096 -p 1024 -g -s 1518 -M -I -Z -S 0 -c 1 -z 2,3 -w 4 -m 100 -n 50 -H -A /storage/n2disk/dna0/timeline
Mixed Mobile
(GTP-encapsulated)
10 Gbit 2.38 Mpps 6% n2disk10g -i dna0 -o /storage/n2disk/dna0/ -b 4096 -C 4096 -p 1024 -g -s 1518 -M -I -Z -S 0 -c 1 -z 2,3 -w 4 -m 100 -n 50 -H -A /storage/n2disk/dna0/timeline
Internet Worst Case
(Youtube and Torrent)
10 Gbit 1.36 Mpps 6-10% n2disk10g -i dna0 -o /storage/n2disk/dna0/ -b 4096 -C 4096 -p 1024 -g -s 1518 -M -I -Z -S 0 -c 1 -z 2,3 -w 4 -m 100 -n 50 -H -A /storage/n2disk/dna0/timeline


As you can see the compression rate strongly depends on the traffic type. We can save from as little as 6% when compressing YouTube streams, up to 95% when compressing synthetic traffic generated by pfsend. In our tests, using mixed Internet traffic (email, web, moderate download) we can save in average 25-40%. So in essence compression ratio depends on the traffic you are going to compress. In some specific environments such as high frequency trading you can squeeze a 100 MB pcap into a 18 MB compressed pcap file, that means that your 10 Gbit storage subsystem can be adequate for saving 2×10 Gbit thanks to the compression.

In conclusion, you need to test on your environment what is your average compression rate based on your typical traffic pattern. The good news are:

  • Compression takes place on-the-fly without affecting capture performance (so why not to use it if it basically comes for free).
  • n2disk companion tools seamlessly handle compressed and uncompressed pcaps.
  • pcap compression is supported on all n2disk versions, running on top of PF_RING, PF_RING ZC/DNA, and Napatech.
  • There is no extra fee for n2disk compression for both existing and new users: give it a try!


ntop at SHARKFEST’14

$
0
0

The ntop core team will be at the SHARKFEST in June, the annual 4-day conference, focused on sharing knowledge, experience and best practices among Wireshark developers and users.

Luca Deri will be among the speakers talking about “Monitoring Mobile Network Traffic (3G/LTE)“.

Join us June 16th through June 20th at the Dominican University of California in San Rafael, CA!

Visualising n2disk Captured Traffic using CloudShark

$
0
0

Introduction


ntop users are familiar with n2disk and the nBox web interface that ease its use.

Show pcap files in a human readable format

Show pcap files in a human readable format

As you know, the nBox includes a small web-based tool that allows you to preview pcap contents.  This tool is good for having an idea of what a pcap contains but it not a fully fledged application. On the other hand CloudShark is the leading application for analysing traffic traces, and thus we have decided to leverage on it for offering the cheapest and most powerful solution for traffic-to-disk and pcap visualisation on the cloud.


From the nBox to the CloudShark Appliance


CloudShark is available as a VM or physical appliance that you can install anywhere on your network or on the cloud.

Cloudshark


The nBox features a preference page where you can insert the credentials of the appliance once. Done that you are ready to use it.


pcap uploaded to CloudShark

As soon as you have captured a pcap file on the nBox, you click on the “Upload to CloudShark” button and the nBox will upload the file onto it. As uploading a large file can take a while in particular over the Internet, the nBox performs this operation in background and notifies you when a task is completed. Done that your pcap file is available on CloudShark and you can go though it using a browser or even a tablet.

Example CloudShark

Below you can find further examples of how this integration has been carried on. Do not forget that with the nBox, in addition to CloudShark, you can also reproduce the same pcap (or set of pcaps, even TBytes of traffic) on a network interface connected to your nBox using disk2n, or visualise pcaps using ntopng installed on the same nBox.

Many thanks to the CloudShark team for their support!

PS. If you are a fan of Wireshark and ntop, make sure you attend the Sharkfest 2014, as the ntop team will be there.

Click to view slideshow.


Monitoring Mobile Traffic (3G/LTE) with nProbe and ntopng #sharkfest14

$
0
0

IMG_2165

At Sharkfest 2014 we have made a presentation/tutorial about mobile traffic monitoring using the ntop tools. Those who have not attended the conference can still have a chance to look at the presentation.


Creating a hierarchical cluster of ntopng instances

$
0
0

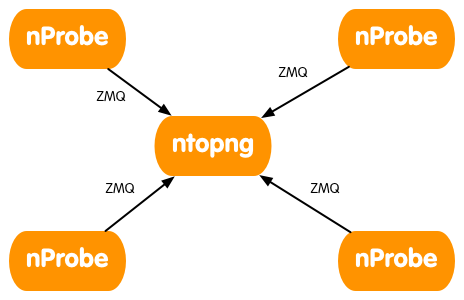
As you know via ZMQ you can use ntopng as collector for nProbe instances. You can decide to merge all probes into one single ntopng interface (i.e. all the traffic will be merged and mixed) or to have an interface per probe.

nprobe_ntopng_hierarchyExample:

    1. Start the remote nProbe instances as follows
      • [host1] nprobe –zmq “tcp://*:5556″ -i ethX
      • [host2] nprobe –zmq “tcp://*:5556″ -i ethX
      • [host3] nprobe –zmq “tcp://*:5556″ -i ethX
      • [host4] nprobe –zmq “tcp://*:5556″ -i ethX
    2. If you want to merge all nProbe traffic into a single ntopng interface do:
      • ntopng -i tcp://host1:5556,tcp://host2:5556,tcp://host3:5556,tcp://host4:5556
    3. If you want to keep each nProbe traffic into a separate ntopng interface do:
      • ntopng -i tcp://host1:5556 -i tcp://host2:5556 -i tcp://host3:5556 -i tcp://host4:5556

Always remember that is ntopng that connects to nProbe instances and polls flows and not the other way round as happens with NetFlow for instance.

Now suppose that you want to create install a ntong instance on each of your remote locations, and want to have a ntopng instance that merges the traffic coming from various locations as depicted below.

nprobe_ntopng_multi_hierarchyIn order to do this you can use the -I parameter in ntopng to tell a specific ntopng instance to create a ZMQ endpoint to which another ntopng instance can poll traffic flows. Note that you can create this hierarchy by mixing nProbe and ntopng instances, or by using just ntopng instances (this in case you do not need to handle NetFlow/sFlow flows).

You can create a hierarchy of ntopng’s (e.g. on a star topology, where you have many ntopng processes on the edge of a network and a central collector) as follows:

    1. Remote ntopng’s
      •   Host 1.2.3.4          ntopng -i ethX -I “tcp://*:3456″
      •   Host 1.2.3.5          ntopng -i ethX -I “tcp://*:3457″
      •   Host 1.2.3.6          ntopng -i ethX -I “tcp://*:3458″
    2. Central ntopng
      •   ntopng -i tcp://1.2.3.4:3456 -i tcp://1.2.3.5:3457 -i tcp://1.2.3.6:3458

Note that:

  • On the central ntopng you can also add “-i ethX” if you want the central ntopng to monitor a local interface as well.
  • The same ntopng instance (this also applies to nProbe) via -I can serve multiple clients. In essence you can create a fully meshed topology and not just a tree topology.

You can ask yourself why all this is necessary. Let’s list some use cases:

  1. You have a central office with many satellite offices. You can deploy a ntopng instance per satellite office and have a single view of what is happening in all branches.
  2. You have a more layered network where each regional office has under it other remote sub-offices.

Please note that the deeper is your hierarchy, the more (likely) the central ntopng will receive traffic from remote peers. So this topology is necessary only if you want to see in realtime what is happening in your network by merging traffic into various locations. If this is not your need, but you just need to supervise the traffic on each remote office from a central location, you can avoid sending all your traffic to the central ntopng and access each remote ntopng instance via HTTP without having to propagate traffic onto a sophisticated hierarchy of instances.

We hope you can use this new ntopng feature to help you solve sophisticated monitoring tasks. We are aware that with these topologies, in particular when used over the Internet, ZMQ might expose your information to users that are not suppose to see it. We are working at adding authentication in ZMQ so that you can set a limit to the users that are able to connect to ntopng/nProbe via ZMQ. Stay tuned.

Introducing ntop Video Tutorials

$
0
0

We have been asked many times to create some videos that introduce novice users to our tools and products. Although English is not our mother tongue, we have decided to take this request seriously and start uploading them on the ntop channel. This said we need your help and we hope that you will contribute by sharing your videos with the whole community.

Mini-Tutorial: Fresh Install of ntopng on Centos 7

$
0
0

This is how to compile ntopng in a fresh centos 7 x64 installation

  • For the impatient:
    • # yum install -y subversion autoconf automake make gcc libpcap-devel libxml2-devel sqlite-devel libtool glib2-devel gcc-c++
      $ svn co https://svn.ntop.org/svn/ntop/trunk/ntopng
      $ ./autogen.sh 
      $ ./configure
      $ make
      $ ./ntopng --help
      ntopng x86_64 v.1.1.4 (r7865) - (C) 1998-14 ntop.org
      <snip>
  • Step by step description
    • Pull the source code from the ntop svn repository. To do this, you need first to install subversion using yum as follows
      $ sudo yum -y install subversion
      
    • Now change your directory to the one you want ntopng in and run
      $ svn co https://svn.ntop.org/svn/ntop/trunk/ntopng
      
    • Once the repository is downloaded, you should run the autogen.sh script
      $ ./autogen.sh
      
    • It will fail due to the lack of a autoconf packages. To step over this run
      $ sudo yum install -y autoconf automake
      
    • and re-run autogen.sh
      $ ./autogen.sh
      ......
      
    • Now autogen.sh completes successfully, then run ./configure, but it will fail due to the missing compiler
      $ ./configure
      .....
      configure: error: no acceptable C compiler found in $PATH
      
    • Install it using
      $ sudo yum install -y gcc

      Next step is the missing libpcap development package

      $ ./configure
      ......
    • Please install libpcap(-dev) (http://tcpdump.org)
      $ sudo yum install -y libpcap-devel
    • Next mandatory package is libxml2-devel required by rrd compilation
      $ ./configure
      .....
    • Please install libxml2(-devel) package (RRD prerequisite)
      $ sudo yum install -y libxml2-devel

      and glib2-devel

      $ ./configure
      .....
    • Please install libglib-2.0 (glib2-devel/libglib2.0-dev) package (RRD prerequisite)
      $ sudo yum install -y glib2-devel
    • now configure require another package
      $ ./configure
      SQLite 3.x missing (libsqlite3-dev): please install it and try again
      
    • Installable running
      $ sudo yum install -y sqlite-devel
    • Now configure works
      $ ./configure
    • You are now ready to compile typing /usr/bin/gmake
      But make will fail due the the missing c++ compiler
      $ make
      configure: error: Unable to find a working C++ compiler
      $ sudo yum install gcc-c++
      
    • After the last installed package, build will fail on json-c compilation with the following error
      $ make
      make: *** [third-party/json-c/.libs/libjson-c.a] Error 2
      
    • To solve this, install libtool package using
      $ sudo yum -y install libtool
      
    • Then rerun make
      $ make
    • and you should have everything compiled successfully.
      Test is running:
      $ ./ntopng --help
      ntopng x86_64 v.1.1.4 (r7865) - (C) 1998-14 ntop.org
      

Enjoy!

Released nDPI 1.5

$
0
0

Today we have have released nDPI 1.5. The main changes include:

  • Support of additional protocols such as Redis, ZeroMQ, Collectd, Megaco.
  • Fixed bugs in existing protocol dissectors and refreshed protocols that changed since the previous release (e.g Skype that is a real moving target).
  • Major improvements of the sample ndpiReader application:
    • Added 10 Gbit DNA/ZC support when capturing live traffic.
    • Added ability to produce JSON reports when reading pcap file traces.
    • Added new protocol encapsulations such as MPLS, PPPoE.
    • Added new protocol/packets statistics (e.g. Ethernet statistics).
    • Fixed bugs when handling IPv6 packets.
    • Introduced lock-less multithread support for improving the overall performance.
  • Reworked the build process (autogen, configure, make).
  • Reworked the library core to  polish code.
  • The HTTP dissector is now able to detect sub-protocols (e.g. Flash video carried over HTTP).
  • Removed obsolete code and cleaned the .h API.
  • Worked with package maintainers to create binary packages.
  • Fixed the code to compile on Windows, embedded platforms, OSX, Linux and the various BSD versions.

Introducing ntopng 1.2

$
0
0

ntopng 1.2 is the result of  10 months of work. We have tried to both introduce new features, and make the product more robust, easy to use, and modern. The result is a simple tool with a refreshed GUI, user preferences, and new reports to display data in new ways.

Peers report

Leveraging on the multi-interface support, ntopng (unless a specific interface is specified) listens on all network interfaces so that you do not have to play with the command line to move from one interface to others

ntopng menu Interface Pause

All the tables are now dynamic with

Dynamic tables in ntopng

all the cells dynamically updating their value with up/down indicators.

We have improved significantly flow collection (sFlow and NetFlow) as well improved the overall performance. As with the previous versions, even in 1.2 we have built on top of the ntopng API and of the JSON data representation. As explained on this post, ntopng is not just a collector, but it can become also a probe so that you can create arbitrary application hierarchies and mix-and-match your ntopng instances the way you like best. You can have a central console monitoring various remote ntopng’s, and thanks to JSON+ZMQ you should not worry about slow network communications and server temporary unreachable as ntopng will take care of these issues on your behalf.

We have worked with the various package maintainer to ease the packaging of the tool on the various Linux and BSD platforms,  ported ntopng to Windows 64 bit platforms for a better experience, and added homebrew support so that OSX users can enjoy ntopng without being programmers. As 1.2 has been just released, please be patient before the updated packages will be included in your favourite distribution. Of course for all the intrepid that want to play with the development code, the SVN repository is still open.

Below you can find a comprehensive list of things we have changed in 1.2. We’ll now have a short vacation and then start working immediately at the next release. Many of our users have asked us to introduce into ntopng the ability to control traffic and thus act as a transparent monitoring + application traffic policer. Others would like to push ntopng in the cloud, by deploying ntopng on cheap boxes that push data on a personal cloud. Others might have other ideas. In essence, it’s now time for you to tell what you have in mind for the next ntopng version so that we can list the features that will be part of the roadmap.

Many thanks to our users that helped us to make ntopng better. Enjoy!


Changelog

  • Fixed some bugs that caused crashes in particular on 32 bit platforms (mostly used on embedded systems).
  • Updated web GUI with the use of Bootstrap 3 and many new reports.
  • Added support for system probe analysis (via nProbe with processPlugin). Interface names are now identified with a symbolic name that can be changed by the user. Network interfaces can be enabled/disabled at runtime.
  • Starting ntopng without -i now causes it to open all the network interfaces present on the system.
  • Added support for hardware timestamped packets produced by IXIA devices (– hw-timestamp-mode).
  • Added coded to reconnect to redis automatically in case of redis restart.
  • Added changes for running ntopng on SecurityOnion.
  • Added -W flag for enable the HTTPS Server on a specific port.
  • Updated —i flag for aggregate multiple collectors traffic, specifying multiple pcap file simultaneously and aggregating their traffic.
  • Added —-json-label flag for using labels instead of numbers are used as keys to saving flows.
  • Added —I flag for exporting flows using the specified ZMQ endpoint in order to create and hierarchies of ntopng Instances.
  • Added -A flag for data aggregations for clustering information based on homogeneous information.
  • Added -g flag for bind the capture/processing thread to a specific CPU Core (Linux only).
  • Added the concept of runtime preferences and added a new menu in the web GUI for handling them.
  • Added -k flag for enable the http:bl service that can be used to trigger alerts for hosts that have been put on blacklist based on their bad behaviour.
  • Added alerts system with many customisable thresholds that can be logged on syslog.
  • Extended host reporting information with new reports and enhancements to existing ones.
  • Added the Historical Interface for loading flows saved in SQLite format, specifying an time and date interval.
  • Added VLAN and subnet support.
  • Performance improvements both in nDPI and the ntopng engine.
  • Improved host correlation techniques.
  • Added support for Windows 64 bit (32 bit ntopng support has been discontinued even though ntopng still works on Win32).
  • Added support for *BSD platforms and various Linux versions.

PS: Here at ntop we’re probably more ants than grasshoppers being us unable to communicate to our community all the work we do. If somebody wants to join us and help with (both) code development and communications, this is a good time to raise your hand.

Viewing all 544 articles
Browse latest View live