Quantcast
Channel: ntop
Viewing all 544 articles
Browse latest View live

What’s New in ntopng: Keep an Eye on Lateral Movements

$
0
0

Hello everybody!

Welcome back to the weekly blog post of this serie used to update you with the latest ntopng features and graphical changes. Please let us know your feedback!

Today we are going to talk about the Service Map.

As you probably know, one of the most troublesome problems in a network, when it comes to security threats detection, is discovering Lateral Movements. Lateral Movements can be defined as network activities that an Attacker does when he gain access to a device in the victim’s Local Network, and starts jumping from a local device to an other with the aim of getting access to the device(s) he is really targeting.

In ntopng it is possible to detect those attacks by using the Service Map!

An initial implementation of the Service Map was already available more than one year ago, but we recently improved and optimized this component, both in the backend and the GUI (e.g. by adding more filtering capabilities and improving the user experience when moving between maps and adding filters).


Which information can you find in this map? A lot of useful informations:

  • The usual flow tuple (Client, Server, Protocol, Application, Server Port);
    note: in case of local connections, the only important thing to detect lateral movement is the server port, the client port is ephemeral.
  • The number of connections (flows) seen with the same tuple;
  • The info field;

These information are really important in understanding and finding Lateral Movements. What is also important is also the ability to set the Learning Period, which is available when configuring the Service Map.

This is used to understand and let the ntopng user decide which flow is allowed in a local network and which not.

It is possible to decide if the flows seen during and after the learning period are: Undecided (let the user check them and put them to Allowed or Denied), Allowed or Denied.

Whenever a flow marked as Denied is seen in the local network, an alert is going to be triggered if the relative check is enabled.

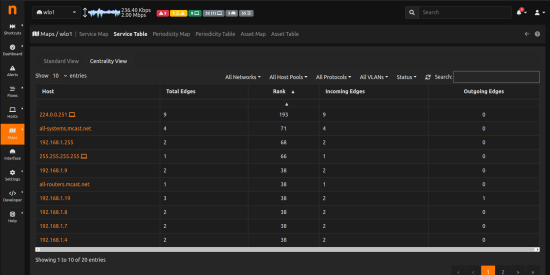
Lastly, we realized that, for large networks, finding a possible lateral movement may be pretty difficult, even with both Service Map representations (map and table). For this reason we decided to add a new view: the Centrality View.

This view is really useful because it gives a rank to the hosts (using an nDPI algorithm that classifies hosts) which helps identifying which hosts are doing suspicious traffic by assigning a high rank to them, other then reporting other interesting information like the total number of Inbound and Outbound edges.

Enjoy!


HowTo Deploy nProbe and ntopng on the Cloud

$
0
0

Some of our customers deploy ntopng on the cloud in order to collect flows coming from private nProbe instances often deployed on private networks or clouds. Thanks to ZMQ/Kafka communications, data sent by nProbe to ntopng travel encrypted; this is contrary to many other cloud-based collectors that instead receive clear-text IPFIX/NetFlow flows sent by exporters devices.

In this setup ntopng cannot poll the routers as they are on a private networks thus unreachable from ntopng. This means that ntopng cannot poll router interfaces via SNMP and thus to report symbolic interface names on the web GUI, and a workaround has to be identified in order to allow the collector to map interface id to names. This solution works when ntopng collects flows exported by nProbe. In this case you can:

  • Poll the interface names via SNMP and save their name in a text file
  • Use the --snmp-mappings option in order to let nProbe know the interface names
  • Such names are propagated to ntopng via ZMQ (i.e. do not forget to specify --zmq)

The --snmp-mappings option specifies the path of a text file containing the interface names of all flow exporters collected by nProbe (collector mode), or of the host where nProbe is active (probe mode). The file format is pretty straightforward: the first column is the flow exporter IP address, the second is the SNMP interface Id, and the last column the SNMP interface name.

# AgentIP ifIndex ifName
#
127.0.0.1 1 lo0
127.0.0.1 2 gif0
127.0.0.1 3 stf0
127.0.0.1 4 en0
127.0.0.1 5 en1
127.0.0.1 6 en2
192.168.1.1 11 utun0
192.168.1.1 12 utun1
192.168.1.1 13 utun2
192.168.1.1 14 utun3

In order to ease the creation of such file, the nProbe package comes with a companion tool part of the nProbe package, named /usr/bin/build_snmp_mappings.sh that you can use to create such file by polling the router via SNMP. The tool syntax is straightforward as shown below:

$ /usr/bin/build_snmp_mappings.sh
Usage:   build_snmp_mappings.sh <SNMP agent IP> <SNMP version 1|2c> <SNMP community>

Example: build_snmp_mappings.sh 127.0.0.1 2c public > snmp_mappings.txt
         nprobe --snmp-mappings snmp_mappings.txt ...

$ /usr/bin/build_snmp_mappings.sh 127.0.0.1 2c public > snmp_mappings.txt
$ cat snmp_mappings.txt
         127.0.0.1 1 lo0
         127.0.0.1 2 gif0
         127.0.0.1 3 stf0
         127.0.0.1 4 EHC250
         127.0.0.1 5 EHC253
         127.0.0.1 6 en0
         127.0.0.1 7 en3
         127.0.0.1 8 en1
         127.0.0.1 9 p2p0
         127.0.0.1 10 fw0
         127.0.0.1 11 utun0
         # Agent InterfaceId Name

Using SNMP Mappings

Suppose nProbe to collect packets from interface en3 and sends them to ntopng in flow format. You need to start nProbe and ntopng as follows:

  • nprobe --snmp-mappings snmp_mappings.txt -i en3 --ntopng zmq://127.0.0.1:1234 -t 3 -d 3 -b 2 -u 7 -Q 7
  • ntopng -i zmq://127.0.0.1:1234

As you can see ntopng has been able to map the interface id to name (en3). Note that the above setup works both with ZMQ and Kafka.

If you want you can read more about this topic in the nProbe manual.

Enjoy !

What’s New in ntopng: a Periodic ‘Problem’!

$
0
0

Hello everybody!

Welcome back to the weekly blog post of this serie used to update you with the latest ntopng features and graphical changes. Please let us know your feedback!

Today we are going to talk about the Periodicity Map.

You are probably asking yourself what’s so bad about periodic activities, right? First of all, let’s take a look at the Periodicity Map and what are the contained information.

What we can see here is:

  • The last seen – last time ntopng has seen a periodic activity (flow)
  • The quintuplet – which is used to identify the flow and consists of client IP, server IP, server port and protocol (Transport and Application protocols)
  • The number of observations
  • The frequency of the observations

One other important information that you can see in this page is towards whom the most periodic flows are.

What is nice here is that you can configure ntopng to send an alert whenever a new Periodic Activity shows up in the network, by enabling the corresponding alert as shown in the picture below.

Let’s jump back to the first question, what’s so bad about periodic activities?

There are many cases in which periodic activities are not legit or expected, this is for instance the case of BotNet activities (an overlay network of machines infected by malicious software and controlled as a group without the owners’ knowledge, e.g. to send spam or launch DDoS attacks).

A BotNet needs to constantly monitor the infected hosts to see if they are available or not, or to check for new commands, and here comes in hand the Periodicity Map. By finding the presence of periodic flows in your network, ntopng is able to detected these kinds of attacks!

Awesome isn’t it? ;)

Enjoy!

Introducing Lua-based Host and Flow Behavioural Checks

$
0
0

With ntopng version 5 we have migrated performance sensitive sections of the ntopng engine from Lua to C++. This has enabled ntopng to scale up nicely while reducing resource needs such as CPU and memory. The drawback is that writing behavioural checks in C++ is not something that everyone can do. For this reason we are introducing two (one for Flows and the other for Hosts) behavioural checks that enable the check logic to be written in Lua. In order not to jeopardise the ntopng v5 performance, these checks are very lightweight and are designed to code checks in a few lines of code.

The idea of this work is to enable end-users with little Lua coding experience, to be able to create custom checks for their own needs. Examples include trigger an alert whenever a:

  • TLS flow uses specific certificate/ciphers.
  • Host is contacting unexpected peers.
  • Flow uses a forbidden protocol (e.g. SMBv1).
  • Host exceeds a specific traffic threshold for a specific protocol (e.g. trigger an alert when host X mae more than X MBytes of DNS traffic)

Below  you can find a couple of examples that should give you an idea of how simple is the API.

Lua Host Check

In order to enable the Lua Host Check you need to enable the “Host User Check Script” in the behavioural checks list and write a the Lua script you can place at /usr/share/ntopng/scripts/callbacks/checks/hosts/custom_host_lua_script.lua

The script is executed periodically on all hosts (typically every minute). In the script ntopng allows you to access a new object named host that points to the current host being checked.

Typically, users check the host for specific conditions (e.g. trigger an alert for all multicast hosts) and trigger an alert that will then appear in the alert page as shown below

For instance the script below triggers an alert for all blacklisted hosts:

if(host.is_blacklisted()) then
   local score   = 100
   local message = "blacklisted host detected"

   host.triggerAlert(score, message)

   -- Tell the ntopng engine to skip this host for future checks as we have already evaluated it
   host.skipVisitedHost()
end

You can find a comprehensive example at this page.


Lua Flow Check

In order to enable the Lua Flow Check you need to enable the “Flow User Check Script” in the behavioural checks list and write a the Lua script you can place at /usr/share/ntopng/scripts/callbacks/checks/flows/custom_flow_lua_script.lua

The script is executed once on all flows as soon as the nDPI protocol detection is completed (and thus the L7 protocol has been detected). In the script ntopng allows you to access a new object named flow that points to the flow being checked.

Typically, users check the flow for specific conditions (e.g. a specific host is not using the expected DNS server) and trigger an alert that will then appear in the alert page as shown below

For instance the script below triggers an alert for all flows whose destination port is 53

if(flow.srv_port() == 53) then
   local score   = 102
   local message = "dummy alert message: port 53 detected"

   flow.triggerAlert(score, message)
end

-- IMPORTANT: do not forget this return at the end of the script
return(0)

You can find a comprehensive example at this page.


Extending Flow and Host Classes

As these lua scripts are designed to be lightweight because they are executed while traffic is processed, these scripts must be short in size and efficient. For this reason the class methods are simple and designed to return little information in order to minimise the amount of information exchanged between the ntopng engine and these scripts. Currently, the flow and host classes implement various methods for the most popular information used in scripts. However they can be easily extended by adding new methods as follows:

  • The lua flow class is implemented in LuaEngineFlow.cpp and defined in the _ntop_flow_reg table at the bottom of the file.
  • The host flow class is implemented in LuaEngineHost.cpp and defined in the _ntop_host_reg table at the bottom of the file.

Whenever a new method needs to be defined, it can be added to the above tables and the lua script will recognise it immediately. We invite our community to contribute with pull requests in order to implement new methods that can be useful in scripts.


Final Remarks

We encourage all ntopng users to learn the Lua Host and Flow Checks API in the ntop API documentation. This feature is present in all ntopng dev versions (from community up) and we hope it will pave the way to our community to develop new checks. Of course we need your feedback as we’re aware that you might need additional features that are not implemented. Please let us know your views using our community channels.


Enjoy !

ntop Webinar on Dec 14th: Community Meeting and Future Plans

$
0
0

Many things have happened this year: new products, several improvements to existing tools, and a lot of new ideas that we want to discuss with our community.

For this reason we have organised a webinar on December 14th at 16:00 CET / 10:00 EST for meeting our community, show what we’re doing and plan where we wanna go next year.

This event will be held online (using Microsoft Teams) in English, and you can reserve your spot using this link.

We hope to meet you all !

What’s New in ntopng: Network Assets

$
0
0

Hello everybody!

Welcome back to the weekly blog post of this serie used to update you with the latest ntopng features and graphical changes. Please let us know your feedback!

Today we are going to talk about the Asset Map.

Have you ever asked yourself, what are the NTP servers in your network? Or, are all active DNS servers?

Well, the Asset Map is useful  exactly in this case.

The Asset Map is a map we designed to know what exactly is (are) the DNS, NTP,… server(s) active in a network. This could be really useful in many case,  just think of a couple of cases:

  • If you are an ISP, many users “use” your network and you’d like to know if your network was compromised, or if the users you have are correctly using the resources you gave them, correctly.
  • If you instead have a large or small network, you’d like to know if you configured correctly the entire network with the right DNS, SMTP,… servers or if by mistake (or not) you have some unwanted server.

The Asset map is a “simply” a map showing the flows with specific protocols used in order to understand and see which are your assets (currently limited to):

  • DNS server
  • NTP server
  • SMTP server
  • POP server
  • IMAP server

The asset map will depict the above servers and include service edges. This is both useful to understand if there was some misconfiguration in your network, or if some of your machine is infected (there are many attacks where infected hosts presets themselves as DNS or NTP even if they are not).

This feature is the first step towards asset management support in ntopng. We’re working hard at developing it, and this will be one of the new features of the upcoming release. Stay tuned !


Enjoy!

HowTo Monitor Zoom Performance and Video/Call Quality

$
0
0

Zoom is a popular platform for video communications and team collaboration. As many other cloud services, network administrators need to supervise Zoom network traffic usage. DPI toolkits such as nDPI are useful for identifying Zoom traffic for supervising the network bandwidth used by your Zoom calls.

Recently we have took advantage of this research work to improve Zoom protocol dissection in order to

  • Recognise Zoom video, audio, and screen sharing streams (previously they were classified just with a generic Zoom label).
  • In addition to existing metrics such as bandwidth or latency, interpret correctly Zoom traffic hence to compute traffic quality metrics.

For this reason we have enhanced nDPI, ntopng and nProbe to report comprehensive Zoom traffic statistics and thus be able to better evaluate the traffic quality. Before we continue this discussion, let’s see how Zoom traffic looks like (you can use this Wireshark):

  • TLS is used to communicate with the Zoom servers for connection setup, char, lifecycle and everything not related to multimedia data.
  • Video, audio and screen sharing data is transported on UDP port 8081. Based on the Zoom session (e.g. you start with audio, then share the screen), the same UDP flow can carry audio, video and screen sharing. For a single call multiple UDP flows can be active from your system to the Zoom servers. Both audio and video sessions use a Zoom-proprietary header before encapsulating real data over RTP. The UDP stream can also carry encapsulated RTCP traffic, that on non-Zoom communications is usually reported on a separate UDP flow.

In ntopng you can now see the flow nature (e.g. audio, video, or screen sharing) and so account the amount of traffic for each flow type.

Below you can see flow details that displays the Zoom flow nature.

nProbe is now able to report communication quality. In addition to traditional network metrics (e.g. bytes and packets), it can report for audio and video streams

  • RTT
  • Jitter
  • Packet Loss (per direction)
  • R-Factor
  • Pseudo MOS that can be used to determine the call quality: 3.6-4.0 acceptable quality, 4.0 and up desirable quality.
10/Dec/2022 20:37:32 [rtpPlugin.c:185] 192.168.1.178:59212 -> 206.247.93.191:8801 [src2dst][RTT: 18.50][Jitter: 13.97][# Packet Lost: 0.00 %][R-Factor: 91.79][Pseudo MOS: 4.38][Zoom: Zoom Video]
10/Dec/2022 20:37:32 [rtpPlugin.c:185] 206.247.93.191:8801 -> 192.168.1.178:59212 [dst2src][RTT: 20.32][Jitter: 27.73][# Packet Lost: 9.79 %][R-Factor: 66.58][Pseudo MOS: 3.43][Zoom: Zoom Video]
10/Dec/2022 20:37:32 [rtpPlugin.c:185] 192.168.1.178:58290 -> 206.247.93.191:8801 [src2dst][RTT: 40.56][Jitter: 6.35][# Packet Lost: 0.00 %][R-Factor: 91.62][Pseudo MOS: 4.38][Zoom: Zoom Audio]

The above trace is produced for instance using the command below that can be used with both live and pcap captures:

  • nprobe –dont-reforge-timestamps -T “@NTOPNG@ @RTP@” -b 2 -i ~/pcap/zoom_video.pcapng  | grep MOS

Thanks to these enhancements, you can now monitor in detail Zoom traffic and:

  • Determine how much bandwidth is used by Zoom audio/video/screen calls.
  • Perceived user call quality using standard metrics already used in VoIP calls.

Enjoy !

Short 1Q23 Roadmap

$
0
0

Happy new year ! At ntop we’re working hard even during these to finish new software releases that we plan to release this quarter. In our December 2022 webinar we have previewed our ongoing developments that we plan to complete soon, and that include:

  • First release of cockpit-based totally redesigned nBox GUI that everyone can use to create its own ntop-based monitoring device.
  • Release of nTap stable.
  • Release of improved nProbe that included native nTap support and redesigned Kafka implementation.
  • Vastly improved ntopng release that includes
    • Redesigned timeseries support: you can finally visualize and compare timeseries.
    • Python-based scripting: create your stand-alone application that uses ntopng as datasource.
    • Lua-based Flow and Host checks for implementing efficient behavioural checks on live traffic.
    • Added any new sensors including detection of periodic activities or traffic towards existing that can be used for driving network analysts towards the relevant issues.
    • Improved traffic analysis and new alert analyser component for visualising and exploring detected alerts.

In the coming weeks we will publish some blog posts to present what we’re implementing so that you can be prepared to the ne release.

Finally, we’re organising the Network Devroom at FOSDEM 2023: we would like to meet the ntop community. So if you plan to be around, please drop us a message so we can meet.

Enjoy !


HowTo Use Periodic Traffic Analysis in Cybersecurity

$
0
0

Since v5 ntopng has the ability to detect periodic activities, i.e. activities that are repeated periodically at a given pace. Periodic activities are not bad per se (e.g. an email application fetches new messages every 5 minutes) but it can be a good indicator whenever periodicity is reported in alerts.

For instance looking at the alerts below you can see that a client is making periodic requests to the same server

Looking at the flow, you can see that these are probing attempts as there is no response from the server side. This alert needs to be carefully analysed by security/network analysts to see if the problem is a security issue (the client is using an insecure protocol to attempt server access) or a network problem (e.g. the firewall prevents legitimate activities or the telnet server is down and it needs to be restored).

ntopng allows you to identity periodic flows not only using the periodicity map, but also filtering them in live flows view

It is also possible to filter them in historical flows and alerts using the filter below (please use the “contains” operator as periodic flows can also have other issues as the alerts reported below in this page).

In conclusion: periodic activities aren’t necessarily bad, but they indicate that there is a repeating task happening overtime. A periodic alert is definitively more interesting and it needs to be analyses to see if it indicates a failed activity that is periodically repeated, or more subtle probing attempts that instead need to be processed differently. In this analysis ntopng can definitively help you to answer the above questions.

Enjoy !

Using Python (including Jupyter Notebook) with ntopng

$
0
0

Most programmers and network/security administrators are familiar with the Python language. As from time to time we receive requests from our users for creating custom reports, or extracting other type of data (e.g. alerts or timeseries) from ntopng, we have decided to create a Python API for ntopng. Such API allows developers to extract data from ntopng similar to what other Python APIs do (e.g. pyshark for Wireshark).

Using this API you can

  • Read host statistics
  • Get the active flows list
  • Query network interface stats
  • Search historical flows

Those familiar with Jupyter Notebooks can also use them to interact with ntopng. You can see this example as starting point fo your experiments.

Using the python API is simple. What you need is the latest ntopng dev version (any version will work) and the python APi that you can easily install with

  • pip3 install ntopng

Done that you can write your first application. The API is basically a wrapper around the ntopng REST API so in essence the first thing you need to do is to connect to a remote ntopng instance (using login and password, or the authentication token) and issue queries via the python API.

try:
    my_ntopng = Ntopng(username, password, auth_token, ntopng_url)
    my_historical = Historical(my_ntopng)

    epoch_end   = int(time.time())
    epoch_begin = epoch_end - 3600
    host = "28:37:37:00:6D:C8"
    ifid = 0

    print(my_historical.get_timeseries("mac:traffic", "ifid:"+str(ifid)+",mac:"+host, epoch_begin, epoch_end))

except ValueError as e:
    print(e)

Above you can find a simple example for extracting a time series of the last hour traffic of a specific MAC address. In the example below we extract historical flows from the ClickHouse database.

try:
    my_ntopng = Ntopng(username, password, auth_token, ntopng_url)
    my_historical = Historical(my_ntopng)

    epoch_end   = int(time.time())
    epoch_begin = epoch_end - 3600
    host = "192.168.1.1"
    ifid = 0
    
    select_clause = "IPV4_SRC_ADDR,IPV4_DST_ADDR,PROTOCOL,IP_SRC_PORT,IP_DST_PORT,L7_PROTO,L7_PROTO_MASTER"
    where_clause  = "(PROTOCOL=6) AND IPV4_SRC_ADDR=(\""+host+"\")"
    maxhits       = 10 # 10 records max
    print(my_historical.get_flows(ifid, epoch_begin, epoch_end, select_clause, where_clause, maxhits, None, None))
except ValueError as e:
    print(e)

You can find the python API on github as well as simple examples. Soon we will produce additional code examples and documentation that shows you how to interact with ntopng. Please let us know your feedback on the community channels and feel free to contribute to the API with a pull request.


Enjoy !

Scaling Up: How To Collect, Analyse, and Store Flows at Scale (100 Gbit+)

$
0
0

Most ntop tools such as nProbe cento and n2disk have been designed to run at high speed (today we consider 100 Gbit a high-speed link). ntopng instead has to perform many activities including behavioral traffic analysis that makes it unable to process traffic well above 10 Gbit. In this case you can use nProbe Cento to send ntopng (preprocessed) flows and you can monitor 100 Gbit networks without dropping a single packet.


In the above picture ntopng can handle 25k-50k flows/sec per interface (the exact figure depends on the hardware system you are using). With a single ClickHouse instance we are able to ingress (in our low-end Intel E3 system) up to 100k flows/sec, so a multi-collector interface ntopng can saturate a single ClickHouse server and have slow-downs if making many queries while inserting data.

For this reason we have recently enhanced ClickHouse support (in dev branch that soon will become stable) in order to support the following topology:

In essence we can now deploy multiple ntopng instances writing to:

  • A single/stand-alone ClickHouse instance.
  • A ClickHouse cluster. You can read more here about configuring a ClickHouse cluster and using it from ntopng.

A ClickHouse cluster can provide (depending on its configuration, number of nodes and network speed) redundancy, capacity (several billion records accessed instantaneously), and performance. With this ntopng enhancement, it is possible to scale up with flow collection/analysis as we have designed an architecture where the main configuration problem is to distribute the load across all the ntopng instances, as everything else will scale automatically.

nProbe can natively distribute flows across multiple ZMQ connections or using Kafka, so you need to make sure that you are configuring your flow-exporter devices in order to distribute flows across all the available nProbe collectors. When this is not possible and all flows are sent towards the same collector IP:port, the nProbe package contains a too named nfFanout that is designed to handle hundred of thousand flows/sec.

$ nfFanout 
Copyright (C) 2010-23 ntop.org
Usage: nfFanout -c <port> -a <collector IPv4:port> [-a <collector IPv4:port>]*
               [-v] [-V] [-r] [-h]
  -c <port>              | UDP port where incoming flows are received
  -a <collector IP:port> | Address:port where to send collected flows to
  -r                     | Use round-robin instead of fan-out
  -v                     | Enable verbose logging
  -V                     | Show application version
  -h                     | Print this help

  Example: nfFanout -c 2055 -a 192.168.0.1:1234 -a 192.168.0.2:1234

This tool solves two problems:

  • High-Availability: when used in fanout-mode it can replicate the collected flow by sending it to multiple destinations.
  • Load-Balancing: when used in round-robin mode it can distribute collected across multiple nProbe instances without reconfiguring flow exporters whenever you want to change the number and location (i.e. the IP address of the server where nProbe runs) of the nProbe instances.

Remember that if you just want to collect flows with no analysis or visualisation whatsoever, you can directly egress flows from nProbe to ClickHouse if necessary.

So now you know how to handle hundred of thousand flows/sec, visualise them and produce behavioural alerts.


Enjoy !

Rethinking Flow Visualisation in ntopng

$
0
0

For years ntopng has listed flows in a tabular view. Our users are used to it, and over time we have added new features and filtering capabilities. What we have not yet done, is rethink how flows are reported. Reworking the ntopng GUI is something we will tackle in the next major ntopng release, but for the time being we have started with tiny changes that should ease the process of understanding what is happening. For this reason the flow page has been extended with a new analysis menu entry.

Selecting the analysis tab will bring you a new page that shows flows collapsed per protocol on a small table (see below for an example).

With this new table you can immediately see what are the top protocols in your network that

  • Have most flows.
  • Make most of the traffic.
  • Have most client and server hosts.
  • Are most popular for your users.

Clicking on the application protocol brings you to the list of flows for such protocol. This little enhancement available in all ntopng versions (ev branch and soon in the stable), allows our users to immediately see what is happening using a small table instead of navigating a long list of flows. All credits go to our friend Federico for suggesting this new visualisation.


Enjoy !

Using Multitenancy in ntopng

$
0
0

Not all ntop users know that ntopng natively implements multitenancy support. Namely you can use ntopng to collect and analyse traffic from multiple users, and show to each user its own traffic, hiding all the rest. All you need to do is very simple

  • Start ntopng and configure it to receive monitored traffic. You can do it via flows or packets.
  • Create ntopng users and for each user specify the traffic restrictions.

ntopng will honour all this. Let’s now see this in detail.


Flow and Packet Collection

ntopng allows you to specify the data source. You do this with the -i option. For instance you can use “-i eth0” for capturing and analysing traffic on the eth0 interface, or “-i zmq://192.168.1.200:1234” for connecting to nProbe running on host 192.168.1.200 listening on port 1234. You can define multiple -i if you need to collect flows or capture packets on multiple interfaces, or (for flow only) you can run ntopng in collector mode. Below you can see depicted and example of two nProbes running on remote hosts, each capturing traffic on a local eth0 interface all sending flows to a central ntopng instance.

This setup is great if you want to keep split traffic originated from each remote nProbe. For instance this is the typical case of each remote nProbe monitoring traffic of two customers, and you want to avoid to mix this traffic on the ntopng side, by creating a virtual collector interface per customer. Note that in this setup, ntopng connects via ZMQ (on top of TCP) to the remote nProbe’s (i.e. each nProbe is the server accepting connections initiated by ntopng).

Instead if you have a customer with multiple remote sites, each monitored by a nProbe instance, you can send all flows to the same virtual ntopng collector interface,

The configuration is slightly different with respect to the previous case (and probably simpler), as in this case all the probes are configured in the same fashion all sending flows to the same ntopng.

Of course you can add to ntopng multiple interfaces, depending on your topology. Just keep in mind a couple of details:

  • You can merge traffic on multiple interfaces using the view interface. For instance, if you add “-i view:all” ntopng creates yet another interface merging all the traffic from the existing interface. Note that “-i view” accepts interface name if you do not want to merge all traffic. Example “ntopng -i eth0 -i eth1 -i eth2 -i view:eth0,eth1” will create a view interface containing only traffic from eth0 and eth1 not not eth2.
  • In ntopng each interface runs on a separate thread. So beside a little thread number increase as the number of interfaces increase, the ntopng performance will be better with respect to sending traffic to a single interface as in this case you can better exploit multicore architectures.

User Configuration

Now that the collection infrastructure has been setup we need to configure user rights. Namely, make sure that each user can see only the traffic that matters him/her and not all monitored traffic. Said that ntopng can also authenticate users via Radius and LDAP, suppose we want to create local users that can see part of the monitored traffic limiting its visibility to his traffic, hiding all the rest of traffic ntopng monitors.

You can achieve this by creating a user (left sidebar Settings -> Users) as follows:

  • Role: usually these users are non privileged, as privileged users could change the settings and thus overcome all limitations.
  • If you have divided ingress traffic using interfaces, you can bind this user to an interface so that he could only see this interface and not the others. Instead if you need to restrict (also) based on the IP addresses this customer own, you can set them in the allowed network box.
  • You can decide if these users can see alerts and historical flows (if ClickHouse has been enabled) by setting the toggles at the end of the table.

Done this, when a user connects to the ntopng web interface only the information that matters is shown and all the rest is hidden, this including historical flows and alerts. Note that some information might seem to be inconsistent (for instance the total throughput) as individual users can see interface counters but only a subset of flows/hosts/alerts.

That’s all. Happy ntopng multitenancy.

Enjoy!

Introducing PF_RING 8.4: Zero-Copy Promisc Capture on Virtual Functions

$
0
0

This is to announce a new PF_RING release 8.4 !

This stable release adds zero-copy support for a new range of (virtual) adapters from Intel: the iavf-zc driver can be used to capture traffic from i40e (X710/XL710) and ice (E810) Virtual Functions. This new driver paves the way for new packet capture architectures as it enables high-speed promiscuous capture on Virtual Functions by leveraging on the SR-IOV trust mode available on Intel E810 adapters. It is now possible for instance to capture all traffic hitting the physical interface from multiple Virtual Functions (promiscuous mode), or filter it based on the VLAN or MAC address.

This new release also adds full control on the hardware clock availble on E810 adapters, in fact it includes a new API for reading, setting and adjusting the adapter clock, get packet timestamps, send packets and read the exact transmission time. The NVIDIA/Mellanox support has also been improved, by extending the filtering capabilities, and adding more tools/sample code to capture or transmit traffic fully leveraging on the multiqueue/multithread support.

Many other improvements are available in this release, please check the full changelog below for the whole list! Enjoy!

Changelog

PF_RING Library

  • New API pfring_get_ethtool_link_speed
  • Add vlan_id to flow rule struct
  • Add optimization flags to BPF filters compiled with pcap_compile
  • Fix pfring_open_multichannel

PF_RING Kernel Module

  •  Add keep_vlan_offload option to avoid reinserting VLAN header on VLAN interfaces when used inline

ZC Library

  • New ZC APIs (available on supported adapters)
    • pfring_zc_get_device_clock
    • pfring_zc_set_device_clock
    • pfring_zc_adjust_device_clock
    • pfring_zc_send_pkt_get_time
  • Add new pfring_zc_run_fanout_v3 API to support more than 64 fan-out queues
  • Add support for capturing stack packets, used by zcount and zbalance_ipc

PF_RING Capture Modules and ZC Drivers

  • New iavf-zc driver to support i40e and ice Virtual Functions
    • Support for VF trust mode on ice adapters (promisc with SR-IOV)
  • Improve ice driver (E810 adapters)
    • Update ice driver to v.1.9.11
    • Add support to get time, set time, adjust time, send get time
  • Improve the NVIDIA/Mellanox (mlx) driver
    • Extend hardware rules
    • Add support for VLAN filtering
    • Add set_default_hw_action API
    • Fix reported link speed
    • Fix bidirectional rules
    • Fix pfring_poll support
  • Improve the Napatech driver
    • Add nanosecond timestamp capture when using the packet API in PCAP chunk mode
  • Improve the ZC drivers API to support more callbacks
  • Add socket extensions (getsockopt/setsockopt):
    • SO_GET_DEV_STATS (get_stats ZC drivers callback)
    • SO_GET_DEV_TX_TIME (get_tx_time ZC drivers callback)
    • SO_SET_DEV_TIME (set_time ZC drivers callback)
    • SO_SET_ADJ_TIME (adjust_time ZC drivers callback)
  • Add management_only_mode to allow opening multiple sockets on the same ZC interface
  • Update drivers to support latest RH 9.1, Ubuntu 22, Debian kernels

FT Library

  •  Fix double free

nBPF

  • Add icmp protocol primitive support

nPCAP

  • Update npcap lib to support for nanosecond time in packet extraction

PF_RING-aware Libpcap/Tcpdump

  • Update tcpdump to v.4.99.1
  • Update libpcap to v.1.10.1

Examples

  • Add ztime example
    • Ability to set/adjust the card clock without capturing/transmitting traffic (external process)
    • Test for the send-get-time feature
  • pfsend
    • Flush queued packets when waiting at real pcap rate and on shutdown
    • Fix headers ranzomization
    • Fix crash with -z
  • pfsend_multichannel
    • Add support for controlling IPs generated
  • pfcount
    • Add -I option to print interface info in JSON format
  • pfcount_multichannel
    • Print full packet metadata with -v
  • zbalance_ipc
    • Add support for up to 128 queues with -m 1 and -m 2 (new v3 api)
    • Add -X option to capture TX traffic (standard driver only)
    • Fix check for queues limit
  • zdelay
    • Fix queue size (power of 2)

Misc

  • Add pfcount_multichannel and pfsend_multichannel to packages
  • Service script (pf_ringctl)
    • Add support for configuring RSS via ethtool
    • Add pre/post scripts for ZC drivers
    • Handle multi-line driver conf file
  • Removed obsolete fm10k driver

nProbe 10.2 is Available: Redesigned Kafka Export, nTap and Google Cloud Support

$
0
0

Today we announce the availability of nProbe 10.2 that features native nTap support for generating flows from remote devices, and redesigned Kafka support for both flow export and communication with ntopng. With this respect, the new –ntopng <URL> command line option will replace in the future –zmq as it allows to both specify if ZMQ or Kafka is used to communicate with ntopng (i.e. “–ntopng zmq://192.168.1.10:1234” is the new syntax that replaces “–zmq tcp://192.168.1.10:1234”). In this release nProbe also supports exports to Google Pub/Sub for implementing a scalable datalake. Finally, nProbe now supports Zoom video calls quality measurement that will be soon extended to other proprietary conferencing solutions.

Below you can find the complete nProbe changelog.

Enjoy !

New Features

  • New nTap support (–ntap) for capturing traffic with the new ntop Virtual/Remote TAP (Enterprise M/L/XL)
  • Rework and improve Kafka support (Kafka can be used as an alternative to ZMQ for delivering flow data to ntopng)
  • Introduce support for exporting data to Google Pub/Sub
  • Introduce support for Catchpoint
  • Introduce a new nProbe XL model

Command Line Options

  • Add –kafka-ntopng option to deliver flow data to ntopng
  • Add –snmp-mapping option for mapping SNMP interfaces and export mapping information to ntopng
  • Add –tcp-dont-send-flow-lenght for flow collectors over TCP that do not expect the flow lenght
  • Add –ntopng zmq://: option (–zmq tcp:// is now deprecated)
  • Add support for encrytion keys in hex format with –zmq-encryption
  • Add -J to ignore Netflow sender port
  • Add the ability to specity an alternative topic in –kafka using “,” as topic delimiter
  • Add –accurate-hash flag
  • Change –collector-port|-3 option for ZMQ accepting zmq:// to avoid mixing it with TCP collection
  • Change –use-obs-domain-id-port which is IPFIX only now
  • Rename –use-obs-domain-id-port to –use-obs-domain-id
  • When not specified -n=2055 is now automatically when required (e.g. if – no -P – no –ntopng)

Improvements

  • Add support for Linux cooked sockets v2 capture
  • Preserve L7 protocol across flow updates
  • Improve Zoom handling and add Zoom detection in RTP streams
  • Improved RTP call quality calculation
  • Add caching of application ID/Name mapping exported by Cisco NBAR
  • Add custom formatting of Nokia ULI
  • Improve processing of nasty corner cases (e.g. flows with the same 5-tuple)

Tools

  • New build_snmp_mappings.sh tool to build SNMP interface mapping file (to be used with –snmp-mapping)
  • Improve zmqReflector (ZMQ proxy)
  • Improve sendPcap
    • Add -f option
    • Add the ability to handle multiple senders in the same PCAP file

Fixes

  • Fix HTTP_SITE handling
  • Fix crash in IMAP dissection
  • Fix decoding loop with invalid Diameter packets
  • Fix for supporting reassembly of Diameter flows on non-standard ports
  • Fix bug with –collector-nf-reforge
  • Fix SCTP dissection
  • Fix first/last switched with collector passthrough (–collector-passthrough) when collecting IPFIX data
  • Fix collector passthrough representation of bytes/packets
  • Fix interface aggregation with ZC ice interfaces
  • Fix for reading packets from pcap dumps

Misc

  • Ignoring observationDomainId (i.e. sourceId) for both IPFIX and NetFlow
  • Support for Rocky Linux 9
  • Update support for (latest) OPNsense
  • Windows improvements
  • Update homebrew support

Welcome to nDPI 4.6: code fuzzing, new protocol and flow risks

$
0
0

This is to announce the release of nDPI 4.6 that introduces various improvements with respect to the previous release. Many things changed in this release in terms of number of protocols and robustness thanks to code fuzzing introduced in this release. nDPI now natively supports 332 protocols and 50 flow risks, this in addition to protocols that can be configured using the protocol file. Protocol metadata extraction has been improved in various protocols as well DGA detection in host names.

Below you can find the complete changelog.

Enjoy !


Changelog

New Features

  • New support for custom BPF protocol definition using nBPF (see example/protos.txt)
  • Improved dissection performance
  • Added fuzzing all over

New Supported Protocols and Services

Add protocol detection for:

  • Activision
  • AliCloud server access
  • AVAST
  • CryNetwork
  • Discord
  • EDNS
  • Elasticsearch
  • FastCGI
  • Kismet
  • Liane App and Line VoIP calls
  • Meraki Cloud
  • Muanin
  • NATPMP
  • Syncthing
  • TP-LINK Smart Home
  • TUYA LAN
  • SoftEther VPN
  • Tailscale
  • TiVoConnect

Improvements

Improve protocol detection for:

  • Anydesk
  • Bittorrent (fix confidence, detection over TCP)
  • DNS, add ability to decode DNS PTR records used for reverse address resolution
  • DTLS (handle certificate fragments)
  • Facebook VoIP calls
  • FastCGI (dissect PARAMS)
  • FortiClient (update default ports)
  • Zoom
  • Add Zoom screen share detection
  • Add detection of Zoom peer-to-peer flows in STUN
  • Hangout/Duo Voip calls detection, optimize lookups in the protocol tree
  • HTTP
  • Handling of HTTP-Proxy and HTTP-Connect
  • HTTP subclassification
  • Check for empty/missing user-agent in HTTP
  • IRC (credentials check)
  • Jabber/XMPP
  • Kerberos (support for Krb-Error messages)
  • LDAP
  • MGCP
  • MONGODB (avoid false positives)
  • Postgres
  • POP3
  • QUIC (support for 0-RTT packets received before the initial)
  • Snapchat VoIP calls
  • SIP
  • SNMP
  • SMB (support for messages split into multiple TCP segments)
  • SMTP (support for X-ANONYMOUSTLS command)
  • STUN
  • SKYPE (improve detection over UDP, remove detection over TCP)
  • Teamspeak3 (License/Weblist detection)
  • Threema Messenger
  • TINC (avoid processing SYN packets)
  • TLS
    • improve reassembler handling of ALPN(s) and subclassification
    • ignore invalid Content Type values
    • WindowsUpdate
  • Add flow risk:
    • NDPI_HTTP_OBSOLETE_SERVER
    • NDPI_MINOR_ISSUES (generic/relevant information about issues found on traffic)
    • NDPI_HTTP_OBSOLETE_SERVER (Apache and nginx are supported)
    • NDPI_PERIODIC_FLOW (reserved bit to be used by apps based on nDPI)
    • NDPI_TCP_ISSUES
  • Improve detection of WebShell and PHP code in HTTP URLs that is reported via flow risk
  • Improve DGA detection
  • Improve AES-NI check
  • Improve nDPI JSON serialization
  • Improve export/print of L4 protocol information
  • Improve connection refused detection
  • Add statistics for Patricia tree, Ahocarasick automa, LRU cache
  • Add a generic (optional and configurable) expiration logic in LRU caches
  • Add RTP stream type in flow metadata
  • LRU cache is now IPv6 aware

Tools

ndpiReader

  • Add support for Linux Cooked Capture v2
  • Fix packet dissection (CAPWAP and TSO)
  • Fix Discarded bytes statistics

Fixes

  • Fix classification by-port
  • Fix exclusion of DTLS protocol
  • Fix undefined-behaviour in ahocorasick callback
  • Fix infinite loop when a custom rule has port 65535
  • Fix undefined-behavior when setting empty user-agent
  • Fix infinite loop in DNS dissector (due to an integer overflow)
  • Fix JSON export of IPv6 addresses
  • Fix memory corruptions in Bittorrent, HTTP, SoftEther, Florensia, QUIC, IRC, TFTP dissectors
  • Fix stop of extra dissection in HTTP, Bittorrent, Kerberos
  • Fix signed integer overflow in ASN1/BER dissector
  • Fix char/uchar bug in ahocorasick
  • Fix endianess in IP-Port lookup
  • Fix FastCGI memory allocation issue
  • Fix metadata extraction in NAT-PMP
  • Fix invalid unidirectional traffic alert for unidirectional protocols (e.g. sFlow)

Misc

  • Support for Rocky Linux 9
  • Enhance fuzzers to test nDPI configurations, memory allocation failures, serialization/deserialization, algorithms and data structures
  • GitHub Actions: update to Node.js 16
  • Size of LRU caches is now configurable

Introducing ntopng 5.6: New Reports and Cybersecurity Indicators, Kafka, Lua/Python API, Flow Collection Clustering

$
0
0

This is to announce the availability of ntopng 5.6 stable release that brings several additions and improvements:

  • We have started to introduce responsiveness in ntopng GUI by means of VueJS. All timeseries and historical pages are now rewritten to take advantage of modern web technologies. You can now compare timeseries across hosts, devices, or anything that is a timeseries created by ntopng.
  • In addition to the traditional/efficient C++ alerting subsystems, we have introduced a Lua API for developing new checks in seconds. This is a simple way to quickly prototype custom checks that can eventually be converted in C++ or stay in Lua as the overall performance is very good as we have coded micro-calls.
  • We have introduced a new Python API for extracting data from ntopng and using it as a live data lake. Please check out our examples including live PDF reports generated using ntopng live/historical data. Please attend this session at FOSDEM this week-end for details on Lua and Python APIs.
  • Cybersecurity features, most of which leveraging on the new nDPI 4.6, have been extended with new flow risks and checks.
  • ntopng can now speak Kafka when receiving data from nProbe, and export flows to Kafka consumers.
  • We have improved the application performance by simplifying code and recoding selected components more efficiently.
  • We have made various packaging changes in the OPNsense build due to changes in the latest version of the popular security platform.
  • Support of ClickHouse cluster for scaling up in distributed and large deployments.
  • Historical reports have been improved both in features and look.
  • Fully multitenancy support, including historical data.
  • Live pcap analysis (without ntopng restart) for using ntopng in traffic analysis.
  • We have introduced several new reports on both alerts and live data some of which shown below.
  • nEdge (ntopng inline) finally supports VLAN setup and integration.

In essence with this release we have made various changes that will enable us to plan for great new features in the next release. We will soon announce a webinar that describes all new features in detail. Stay tuned.

Click to view slideshow.

Below you can find the complete changelog.

Enjoy !


ntopng 5.6 Changelog

Breakthroughs

  • Python API
  • Add support Rocky9
  • Add support to Kafka
  • Increased max num of exporters
  • Introduce nTap support
  • Introduce support to ClickHouse Cluster
  • Rework Historical Chart Page
  • Rework pages using VueJS and moving towards responsive client
  • Add XL license

Improvements

  • Handle allowed networks for unprivileged users
  • Improve multitenancy support
  • Improve thread names
  • Improve mac formatting
  • Improve top host sites adding reset method
  • Improve pcap upload
  • Improve ports formatting
  • Improve handling for Cisco NBAR collection
  • Improve source style
  • Improve Linux OS detection
  • Improve Engaged Time Report in Chart
  • Improve passive DNS host resolution
  • Improve alerts reports
  • Improve OPNsense installation instruction
  • Improve host report
  • Improve support to NDPI_TCP_ISSUES flow risk
  • Improve layout
  • Improve ICMP flow handling
  • Lowered memory consumption due to alert score
  • Rework pro code directories
  • Rework lua code
  • Rework flow aggregation
  • Rework capabilities support
  • Socket code cleanup
  • Use API to build interface report
  • Update rrd calculations
  • Update JP localization (courtesy of Yoshihiro Ishikawa)

Changes

  • Add logo to package
  • Add missing deps
  • Add link to host
  • Add options to send report by email
  • Add Report class and example
  • Add internal server error on health/interfaces doc api
  • Add support for external (REST) host alerts
  • Add various help and parameters
  • Add script to create a pdf report from historical API data
  • Add NXLOG/Active Directory documentation
  • Add reload button in various pages
  • Add third party resources
  • Add flow exporter ips to observation points
  • Add support for the python API documentation
  • Add forced offline variable to mantain the –offline option
  • Add support for Lua host engaged alerts using timeout
  • Add observation points ts
  • Add HTTP server in flow details
  • Add token-based authentication
  • Add Flow Risk (Bitmap) Filter in alerts
  • Add make targets for pip package Updated package classes
  • Add L7 information in flow object adding
  • Add CodeQL workflow for GitHub code scanning
  • Add modal-download-file component and add export timeseries png picture button
  • Add critical and emergency status to alerts
  • Add oneway TCP flows counters
  • Add support for nDPI network handling in flows
  • Add -n 4 for name resolution
  • Add IMAP/POP stats
  • Add Stratosphere Labs Blacklist support
  • Add support d3v7
  • Add Requires for RH9 (redhat-lsb-core is deprecated)
  • Add interfaces stats api and refactor the others health api
  • Add support to application protocol and master protocol
  • Add CIDR support in Historical Flows
  • Add new Aggregated Flows page
  • Add new Alerts Analysis page
  • Add support for estimating the number of TCP contacted servers with no reply
  • Add new Ports Analysis page
  • Add detection of periodic flows and exported it as flow risk in both flows and alerts
  • Add REST API to get DB columns and info
  • Add ability to query alerts from Python
  • Add Zoom streams handling
  • Add various checks
  • Add IP-in-IP decapsulation
  • Add Host Rules page (possibility to trigger alerts based on timeseries)
  • Add the ability to analyze a pcap without creating a new interface
  • Add Windows timezone handling
  • Change table definition
  • Cleanup file names
  • Disabled host serialization
  • Enlarged the number of local networks to 1024
  • Increased upload size to 25 MB
  • Implement custom script check
  • Implement support of host filtering with TX traffic sent
  • Implement unresponsive peers host report
  • Implement count of incoming tx peers with TCP flows unanswered
  • Move ts business logic in ts_rest_utils.lua
  • Patch for handling nicely clock drift at startup
  • Remove obsolete autogen commands On Linux stay with g++ unless a sanitizer is used
  • Remove REST API v0 (discontinued since ntopng 4.2)
  • Remove no more used severity
  • Refactor range-picker query_presets
  • Rework host packets page and removed dscp page
  • Rework host ports implementation
  • Rework Historical class
  • Rework OPNsense plugin package build
  • Self test fixes and improvements
  • Update documentation
  • Update REST API
  • Update bootstrap table css
  • Update various pages to vuejs
  • Update counter scaling (no gauge)
  • Update response in service disabled case

nEdge

  • Add support to multi LAN and fixes DHCP service error
  • Add VLAN and multi WAN support to nedge
  • Add routing_policy to nedge configuration callback
  • Fix netplan configuration error
  • Update VLAN trunk doc

Fix

  • Df columns error management, table export formatted with % and column reordering now working
  • Fix missing openssl dependency from MacOS
  • Fix clang
  • Fix host sankey minor issues
  • Fix hyperlinks to historical charts not working
  • Fix hyperlinks not working correctly
  • Fix Regex escape
  • Fix application name resolution on aggregated views
  • Fix RRD driver for step calaculation
  • Fix visual bugs with master and app proto
  • Fix various interface page minor bugs
  • Fix shortened labels
  • Fix default sort not working
  • Fix influxdb retention not updated
  • Fix name and size of charts
  • Fix vlan label not mapped
  • Fix for FreeBSD configure
  • Fix ip resolution not updating the name
  • Fix discrepancy in Traffic Calculation (Interface Chart)
  • Fix measurement units not uniform
  • Fix crash swap
  • Fix bug that reported wrong DNS information
  • Fix build process with opnsense/plugins
  • Fix validators regexps
  • Fix ICMP emtropy report Improved HTTP flows report
  • Fix Telegram Reported alerts contain HTML
  • Fix multi-series Charts are Unreadable in Dark Mode
  • Fix invalid reverse host resolution that caused hosts to be labelled with wrong symbolic name
  • Fix delete obsoleted code from page-stats
  • Fix for circular dependency js
  • Fix overlay not working
  • Fix due to changes to nDPI ALPN handling
  • Fix CSS Inconsistency Across Browsers
  • Fix Deep copy also for array of objects
  • Fix missing modules
  • Fix NAT handling with nprobe
  • Fix initialization crash
  • Removed multiple load from tables
  • ZMQ encryption key is now reported in hex to avoid escape problems

Using ntopng as an Actionable Event-Driven Traffic Analysis Application FOSDEM23

$
0
0

Yesterday we have presented at FOSDEM in the network devroom we headed, a talk about ntopng. Below you can find the video of the presentation and the presentation slides.

Enjoy !

[Webinar] Introduction to ntopng 5.6, Feb 21st 3 PM CET/9 AM EST

$
0
0

This is to invite you to attend a webinar about ntopng 5.6. This webinar will walk you through the innovations introduced with ntopng 5.6 stable release that we introduced at the end of January. You can learn the new features and get acquainted with the changes that have been introduced in the web interface.

Finally, we will introduce a completely new release of the nBox GUI that you can use to manage installations of ntop applications.

The event is free of charge and it will be held online in English language. You will receive the event details and link via email after the registration.

You can register online at this URL.

Hope you can join us !


The Brand New nBox UI is Out

$
0
0

As announced during the last ntop Webinar, the new nBox UI has been released!

What is nBox UI? nBox UI is a web-based User Interface that simplifies the ntop’s software configurations (ntopng, nProbe, nProbe Cento, n2disk, …), assisting with complex things such as creating configuration files and managing the services and let you focus on playing with the applications. nBox UI also helps you manage the box, with the ability to configure the box connectivity, users, etc. nBox UI is in practice what we use to build our nBox Recorder and nBox NetFlow hardware appliances to let users with no system-admin skills to manage their boxes and the installed ntop’s software.

The old Perl/CGI-based nBox web interface was based on obsolete technologies, was hard to maintain and extend, and was running on the latest Ubuntu LTS only due to some OS dependencies. For this reason, we decided to rewrite it from scratch. 

The new nBox UI is based on the Cockpit Project, an Open Source web-based UI for servers sponsored by Red Hat which is becoming the de-facto standard for managing Linux servers using the browser.

nBox UI now runs on most Linux distributions, including Ubuntu, Debian, RedHat, and it’s extensible by means of Javascript plugins. The ntop’s nBox UI in short is a package with includes Cockpit (as dependency) and a set of plugins written in modern HTTP and Vue.js.

Similar to the previous nBox software, nBox UI can be used to configure and run the applications, including ntopng, n2disk, nProbe, Cento, monitor them, run traffic extractions from recorded PCAP traces.

In addition to this, it now also features event notifications, that lets you know with a message on your phone (or an email or any other endpoint supported by ntopng) when an application is started, stopped, or there is a failure, just to mention a few examples.

nBox UI can be installed on most Linux distribution using the packages in our repository. Please also take a look at the User’s Guide for further information.

Enjoy!

Viewing all 544 articles
Browse latest View live