Quantcast
Channel: ntop
Viewing all 544 articles
Browse latest View live

Packet Monitoring using ntop and Cisco ON100

$
0
0

From time to time, Cisco builds ntop-friendly products. This is the time of the Cisco ON100 network agent.

This tiny device that can fit on your hand, has been integrated with ntop for the purpose of traffic monitoring as you can read on this technical note Enabling ntop Packet Monitoring with Cisco OnPlus Service.

ntop is an optional application watching the second LAN port (Monitor port). The Cisco cloud service provides a web tunnel back to the ON100 to ntop’s web service. No data is interpreted, as ntop does that. This way end users can use ntop application without needing to invest in a PC. The ON100 unit has lots of CPU/RAM and ntop seems to behave very well. Since customers can use either (or both) port mirroring or NetFlow, everyone is happy.

You can find more about ntop and ON100 at this discussion page.


SFProbe: Embedding nProbe on an SFP

$
0
0

In 2004 my friend Alex Tudor of Agilent involved ntop on a very challenging project. The idea was to monitor the network from the exact place where packets were originated. In fact popular network taps and span ports are not the right tools as they are added to an existing network (i.e. the network does not need them, but probes do need them). The same applies to active monitoring: traffic should be generated from the right place. So if you want to see the router-to-router latency you should let the router ping the other router, and not an external PC connected to such router. To make this long story short, Agilent decided to put the probe on the best place: namely on the SFP. This is because network equipment need SPFs and putting the intelligence there means that the probe is on the equipment side, on a vendor-independent place. You can imagine that we were involved on the software side (unfortunately we can’t build hardware here) and Agilent on the hardware side. You can see how hardware moved from testing boards

to a complete product. After 6 years since the beginning of the project, JDSU (the former Agilent group running the project was incorporated on that company) has finally made the magic.

They managed to squeeze everything into an ASIC chip and what we prototyped so many years ago is finally a product. Obviously this product is ntop-friendly as nProbe is a JDSU PacketPortal-Validated application. This means that using nProbe with PacketPortal you can analyze not just Internet traffic, but also Triple Play and mobile network traffic including LTE (didn’t you know nProbe was able to do that?).

JDSU has funded many nProbe developments including the VNIC integration features (VLAN tags used as netflow interface id), and if nProbe moved off a research project into a more industry-oriented (yet open source) solution it’s also thanks for all the comments we received during this project. If interested, you can visit the PacketPortal page (click on the “Related Products” for jumping to nProbe). Many thanks to Alistair Scott of JSDU for making all this happen.


Meet ntop @ Cebit 2012

$
0
0

All those visiting Cebit next week, will have the chance to see what we’re doing at ntop for providing better network monitoring services. We will give a presentation at the Open Source Forum next Wedn at 1.45 PM that is organized by the Linux Magazine.

This would be a good time to speak and meet the ntop community. We hope to see you there.

Benchmarking PF_RING DNA

$
0
0

For years networking companies have used the buzzword zero-copy to qualify those hardware/software solutions that allow applications to play with packets without the need to copy them at all. Zero-copy needs DMA (Direct Memory Access) for operating so that applications do not get a (shallow) copy of packets but they actually get the pointer to the packet. As you probably know, PF_RING DNA allows applications to access packets in zero-copy so that in the pfring_recv() call you get a pointer to the packet just receive. Whereas in traditional PF_RING you always get a copy of a packet portion (limited to the snaplen) sitting on a memory ring living on the kernel that is accessed in DMA.

In DNA, zero-copy applies not just to packet capture but also to packet transmission, and bouncing (i.e. you receive a packet on one interface and forward it to another interface). All those who have tested DNA have realized that an old Core2Duo 1.86 GHz is enough for handling TX line rate at 10G, so in general if you own an adequate server, DNA can solve all your RX and TX needs.

Over the past 6 months we have made many changes to DNA, in particular for making it more flexible not just for packet capture but also for packet processing. We have then decided to run some new performance tests in order to position DNA with similar solution such as netmap, and  Intel DPDK that is probably the reference software in terms of packet processing on commodity hardware.

For our tests we used a entry-level server Supermicro X9SCL powered by a Xeon E31230 (4 cores + HyperThreading) fitted with two dual 10 Gbit NICs. For traffic generator we used a Spirent (4 x 10 Gbit ports) kindly provided by Silicom. For packet capture we used pfcount, and for packet receive+forwarding we have used pfdnabounce with a pre-release version of the libzero that will be releasing soon and that allows to operate in zero-copy across network interfaces.

Test 1: Packet Capture

We have connected all 4 ports of the Spirent to the four 10 Gbit ports. We injected 64 bytes packets on all ports. pfcount’s were started as follows

# ~/PF_RING/userland/examples/pfcount -i dna0 -a -g 0
# ~/PF_RING/userland/examples/pfcount -i dna1 -a -g 1
# ~/PF_RING/userland/examples/pfcount -i dna2 -a -g 2
# ~/PF_RING/userland/examples/pfcount -i dna3 -a -g 3

where each pfcount is bound to a different core. The ixgbe DNA driver has been loaded with a single RX queue (as you will read later on this article, one queue is enough).

rmmod ixgbe
insmod ./PF_RING/drivers/DNA/ixgbe-3.7.17-DNA/src/ixgbe.ko RSS=0,0,0,0
ifconfig dna0 up
ifconfig dna1 up
ifconfig dna2 up
ifconfig dna3 up
echo "1" > /proc/irq/52/smp_affinity
echo "2" > /proc/irq/52/smp_affinity
echo "4" > /proc/irq/54/smp_affinity
echo "8" > /proc/irq/56/smp_affinity

Each pfcount has reported minimal packet drop, happened when the Spirent started to inject traffic.A generic pfcount stat is the following:

=========================
Absolute Stats: [1041759799 pkts rcvd][14323 pkts dropped]  Total Pkts=1041774122/Dropped=0.0 %
1'041'759'799 pkts - 87'507'823'116 bytes [15'096'354.76 pkt/sec - 10'144.75 Mbit/sec]
=========================
Actual Stats: 14882462 pkts [1'000.10 ms][14'880'973.90 pps/10.00 Gbps]

So we basically have lost (at startup) about 14k packets over a billion packets received. This while 4 pfcount instances were running simultaneously for a total packet capture rate of 4 x 14.880 Mpps, with each pfcount instance loading the CPU at about 90%.

Test 2: Packet Forwarding

We have connected the Spirent as traffic generator, received and then forwarded packets back to the Spirent using pfdnabounce, and then compared the number of received packets with the original number of packets sent. This is a setup similar to RFC 2544.

As you can read we have lost 139 packets out of 1 billion, while forwarding 64 bytes packets at line rate. Also on this case the loss happened when we started the test.

Final Remarks

So while we’re still trying to improve DNA so that we can see zero loss also on these extreme conditions, we are pretty happy of the tests outcome. First of all because when in 2005 we started the PF_RING project, we would have never imagined that it would have been feasible to capture almost 60 million/pps on a machine that costs about 500 Euro (plus NICs). Second because DNA isn’t second to DPDK  according to some benchmarks you can find googling a bit. We believe that this is a great result for our open source project, although we are working to continuously improve DNA.


PF_RING DNA RFC 2544 Benchmark

$
0
0

Over the past couple of weeks we have further improved the DNA performance, and thus we have decided to test its performance. In order to do reproducible measurements we decided to adopt the benchmark specified in RFC 2544. You can find the complete test details and results on this document: DNA_ip_forward_RFC2544.

As you can read we used a low-end single-CPU Supermicro server X9SCM, Linux Fedora Core 15, and a Spirent SRC-2002HS 10 Gbit traffic generator. On a nutshell DNA has not lost a single packet, even with 64 bytes (60 bytes packet + 4 bytes CRC) packets. Thanks to libzero the forward latency across ports is as low as 3.45 usec with minimal size packets. All this is amazing if you consider that these results have been achieved on commodity hardware, matching the performance of costly FPGA-based NICs.

Many thanks to Silicom for supporting the DNA development and benchmarking.

Getting More Information On Your Network Performance

$
0
0

This week ntop will be present at the Open Source System Management Conference 2012, that will take place this Thursday in Bolzano, Italy, organized by our partner and sponsor Würth-Phoenix. We’ll give a speech about how to analyze network performance with our nProbe/ntop applications, as well how to characterize the applications generating traffic. In fact it is important not to do generic and aggregate metric monitoring, but to characterize flow-by-flow so that we can generate alerts per-application. During the event we’ll speak about future nProbe extensions that we’ll introduce later this month such as the new Oracle plugin for nProbe, and we’ll preview a new layer-7 plugin that will allow you to combine traffic monitoring with layer-7 bridging/shaping leveraging on nDPI. In fact, many people do not understand the need to deploy network monitoring tools until they have issues, whereas in many cases we believe it’s easier to piggy-back network monitoring by means of tools that for instance implement traffic policies, similar to what costly application firewall do today.

For those who cannot attend the conference, you can

We hope to see you soon!

Say hello to Libzero

$
0
0

Last year we have introduced PF_RING DNA for implementing 0% CPU receive/transmission on commodity 1/10 Gbit network adapters. We considered DNA as a starting point, as it implemented high-speed RX/TX that was enough for most, but not all of you. This is because commodity adapters do not feature advanced packet balancing techniques as they rely on RSS, that has several limitations such as asymmetric flow balancing (i.e. the two direction of the same flow are spread onto two different cores) and inability to provide users a way to use their balancing function. Another limitation of DNA, again due to its nature that is close to the hardware, is that packets should be processed in sequence (i.e. in FIFO) whereas applications sometimes need to store packets and process them out of sequence (e.g. in case of fragmented packets, a given packet must be rebuilt with all fragments prior to process it).

Although zero-copy is often a buzzword as only a subset of packet management is really performed without copying any packets, at ntop we decided to see whether it was really possible implement zero-copy for all operations, including packet dispatching to threads and applications (including packet fan-out support), packet queuing, and forwarding across interfaces. This is what libzero is for: as its name says, we can do all these operations in zero-copy, with no performance penalty as you will still be able to reach line rate with minimal packet size (14.88 Mpps with 60+4 bytes packets).

Libzero opens up a new world of opportunities, as it enables developers to focus on their application leaving to the library the task of handling packet memory, prefetching memory to let your applications access packet payload at the same speed as counting packets. Now you can finally scale up applications, as you can for instance spawn several snort applications and, without changing a single line of its code, let each instance handle a coherent (across directions) set of packets, all at line rate. In a nutshell, the network is no longer the bottleneck nor the source of complexity.

The ball is on the software side again. You can find all details at the libzero home page.

Hardware-based Symmetric Flow Balancing in DNA

$
0
0

Years ago, Microsoft defined RSS (Receive-Side Scaling) with the goal of improving packet processing by enabling multiple cores to process packets concurrently. Today RSS is implemented in modern 1-10 Gbit network adapters as a way to distribute packets across RX queues. When incoming packets are received, network adapters (in hardware) decode the packet and hash the main packet header fields (e.g. IP address and port). The hash result is used to identify into which ingress RX queue the packet will be queued.

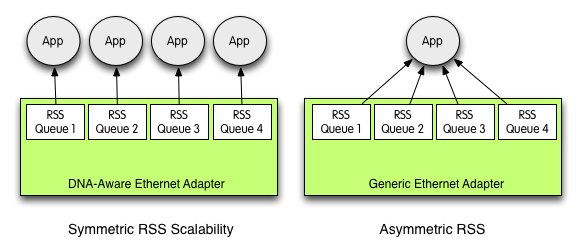
In order to balance the traffic evenly on the RX queues, RSS implements asymmetric hash. This means that packets belonging to a  TCP connection between host A and B, will go to two different queues: A-to-B will go to queue X, and B-to-A will go to queue Y, where X is different than Y. This mechanism guarantees that the traffic is distributed as much as possible on all available queues, but it has some drawbacks as applications that need to analyze bi-directional traffic (e.g. network monitoring and security applications) will need to read packets from all queues simultaneously in order to receive both traffic directions. This means that asymmetric RSS limits application scalability, as it is not possible to start one application per RX queue (and thus the more queues you have, the more apps you can start) it’s necessary to read packets from all queues in order to receive both traffic directions. In a scalable system instead, applications must be able to operate independently so that each of them is a self-contained system as depicted in the figure below.

In PF_RING DNA (starting with version 5.4.3) we have added the ability to reconfigure the RSS mechanism via software, so that DNA/libzero applications can decide what RSS type they need (non-DNA applications cannot reconfigure RSS yet). In general, asymmetric RSS is enough for apps that operate per-packet (e.g. a network bridge), whereas symmetric RSS is the ideal solution for apps such as IDS/IPS and network monitoring applications that instead need full flow visibility.

The advantage of symmetric RSS is that it is now possible to achieve scalability, by binding applications to individual queues. Example, suppose you have a 8-queue DNA-aware network adapter, you can start 8 snort instances, binding each of them to a different queue (i.e. dna0@0, dna0@1…, dna0@7) and core. Each instance is then independent from the other instances, and it can operate properly as it sees both directions of the traffic.

For those who need advanced traffic balancing not based on packet headers (e.g. you want to balance VoIP calls based on the telephone number of the caller), you can take advantage of libzero. In the PF_RING demo applications, we have created a couple of examples based on libzero (pfdbacluster_master and pfdnacluster_multithread), that demonstrate how you can implement flexible packet balancing (see -m command line option of both applications).


PF_RING DNA/Libzero vs Intel DPDK

$
0
0

From time to time, we receive inquiries asking us to position PF_RING (DNA and Libzero) against Intel DPDK (Data Plane Development Kit). As we have no access to DPDK, all we can do is to compare these two technologies by looking at the documents about DPDK we can find on the Internet. The first difference is that PF_RING is an open technology, whereas DPDK is available only to licensees. Looking at DPDK performance reports, PF_RING seems to be slightly more efficient (you can run DNA tests yourself using the companion demo applications) than DPDK on minimal size packets (DNA/Libzero do 14.88 Mpps on multiple 10 Gbit ports), whereas with larger packets their performance should be equivalent. PF_RING’s performance advantage (both in terms of speed and also packet latency) is also with respect to netmap, we believe due to the fact that for minimal size packets the cost of netmap’s system calls is not neglectable.
So where is the main difference then? PF_RING has been created as a comprehensive packet processing framework that could be used out of the box by both end-users and applications developers (the DPDK name looks like is only for developers).

PF_RING for End-Users


Using libpcap-over-PF_RING you can take any pcap-based legacy application (e.g. wireshark, bro), or use PF_RING DAQ for snort, and run all those application at line rate without any code change. The support of symmetric flow-aware hardware traffic balancing in DNA, allows application to really scale by simply spawning more applications as the number of packets to process increase. Using Libzero you can implement your own packet balancing policy across applications in zero-copy as demonstrated by the pfdnacluster_master application. Versatile packet distribution in zero-copy is a unique feature of libzero that allows you to take existing applications, and without changing a single line of code you can balance the traffic across applications at line-rate. This enables PF_RING users to scale exiting applications by balancing incoming traffic across multiple instances, and thus preserve their investments (i.e. you do not have to buy new/faster hardware as traffic rate increases).

PF_RING for Programmers


We have designed PF_RING mostly for programmers, trying to implement all those features that programmers need, so that developers can focus on application development, rather than on packet processing.

  • PF_RING is released under LGPL so that you can build royalty-free open and (closed-source) proprietary applications.
  • No maintenance or SDK fees: ntop does it for free.
  • Line rate packet RX/TX by means of a simple receive/send API call.
  • Low-latency (3.45 usec) packet switching across interfaces. DNA takes care of all low-level details, so that for instance you can receive a packet on a 1 Gbit NIC and forward it on a 10 Gbit NIC. All in zero-copy, and at line-rate of course.
  • Seamless support for hardware (Intel 82599 and Silicom Redirector) and software (PF_RING filters and BPF) packet filtering so that independently of the NIC you use, the PF_RING frameworks takes care of filtering.
  • PF_RING pre-fetches packets content for you, so that if instead of counting traffic you want to do real accounting/payload inspection (e.g. DPI or NetFlow), your CPU does not have to spend cycles just to fetch the packet from memory. You can verify yourself running “pfcount -t” or doing the same on other similar frameworks (netmap’s test application recv_test.c decreases its performance of about 50% when reading a byte from the received packet) to see what we mean.
  • Packet processing in software does not happen in sequence as in hardware. Using libzero you can queue packets in zero-copy and hold the packet buffer until you are done with it (you can even transmit the buffer holding a packet you have just received) so that your application can work on multi-packets (e.g. whenever you need to reassemble a fragmented packet) or multi-thread without copying packet contents (and thus jeopardize performance) as it happens with other frameworks.
  • Native Libzero’s zero-copy packet distribution, supports both divide-and-conquer and scatter-and-gather so that you can partition your packet processing workload across both applications and threads leveraging on the PF_RING framework.

Final Remarks


While most benchmark tools simply count packets without doing any processing to them, real-life packet processing is a much more complex activity. We do not believe that measuring packet capture/transmission performance is the only metric to look at. Instead seamless hardware NIC support, ability to support legacy application, out-of-the-box components for popular applications (e.g PF_RING DAQ), zero-copy operations across threads and applications, framework API richness, are as important as speed. PF_RING features all of them.

Using PF_RING DAQ for high-performance 1/10 Gbit Snort-based IDS/IPS

$
0
0

Months ago we have started to design a new PF_RING DAQ module for snort. We decided to do this project with ENEO Tecnologia who has both sponsored the development and helped us to implement all those tiny features that turned PF_RING DAQ from a simple DAQ adapter to a full fledged module. One of the decisions we made, was to make this new DAQ module able to operate on vanilla PF_RING and also DNA (so that everyone could benefit), and to support complex topologies. In non-DNA mode, we leveraged on PF_RING cluster to distribute the load across multiple snort instances, whereas on DNA we took advantage of symmetric RSS to distribute the load across multiple snort instances. As you will see when using it, basically the network is not the bottleneck anymore, as the processing speed is limited by snort speed and not by packet capture.

Beside getting the PF_RING DAQ module and using it on a generic distribution, ENEO decided to create redBorder IPS, a new Ruby on Rails based Open Source project around Snort. It provides the following capabilities in a centralized manner: event viewing, hierarchical management of multiple sensors, very powerful rule management, and SNMP monitoring. It is in the Sensor were we have been collaborating with ENEO Tecnologia to provide the following capabilities:

  • Customized and hardened CentOS 6.2 system with all needed software packets.
  • Latest Snort & pf_ring versions.
  • IPS mode running on top of PF_RING with specific performance enhancements and capability to drop packets within pf_ring itself.
  • New IDS Forwarding mode running on top of pf_ring reflecting the packets at kernel level and sending a copy to Snort
    IDS mode running on top of clustered PF_RING.

In all cases, we have enhanced Snort’s DAQ to be able to analyze multiple segments from the same Snort instance and load balance between all available cores, thus granting better hardware usage. All of this is freely available for registered users at the redborder project website. The new PF_RING DAQ will be available in a few days with a new PF_RING release, and we are working with them to add support for DNA Libzero. Stay tuned.

ntop 5.0 Released

$
0
0

After a year, it’s time to release a new stable version of ntop. This version deserves a major number, 5.0, as many things have changed. Beside bug fixes and general improvements, in this release we redesigned the ntop engine, that up to version 4.x was a bit cumbersome. We now have a layer 2 (MAC Address) and layer 3 (IP address) so that the old -o flag is no longer used. Sessions are now enabled by default, as they are used widely in ntop. We update netflow collection supporting new flow templates and circumventing better some implementation flows of probes embedded on hardware devices.

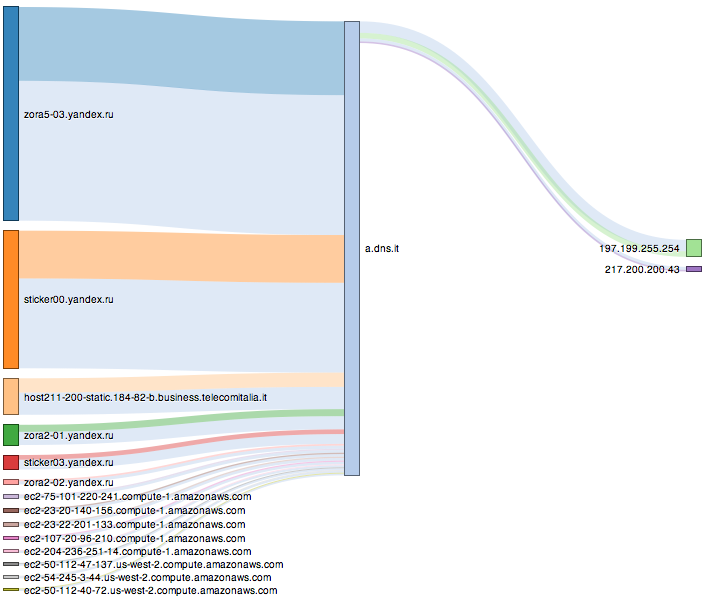
With this release we decided to begin to redesign the GUI, adding new graphs that can better represent facts using a simple and clean design. An example are sankey diagrams that have been used in ntop 5.0 to represent host traffic relationships.

The above diagram shows the connections of host a.dns.it. Each host has a different color, and when a host communicates with another host a new color representation is used. For instance in the above graph sticker00.yandex.ru has exchanged data with a.dns.it. As the color between such hosts is for 1/3 orange (the color of sticker00) and 2/3 violet (the color of a.dns.it) it means that a.dns.it has sent more data to sticker00 than the other way round. Of course you can move chart elements, enable/disable hosts and protocols and thus drill down data.

Another new 5.0 feature, is the support of nDPI that allows ntop to know the real protocol, regardless of the port being used to exchange data. To date more than 140 protocols are supported, and this number will grow in the near future.

We are aware that ntop can be improved, but in order to do that we need your support and feedback. Please share your ideas with us!

10 Gbit (Line Rate) NetFlow Traffic Analysis using nProbe and DNA

$
0
0

In the past couple of years, 10 Gbit networks are gradually replacing multi-1 Gbit links. Traffic analysis is also increasingly demanding as “legacy” NetFlow v5 flows are not enough to network administrators who want to know much more of their network than simple packets/bytes accounting. In order to satisfy these needs, we have added in the latest nProbe 6.9.x releases many new features including:

  • Flow application detection (via nDPI)
  • Network/application latency
  • Support of encapsulations such as GTP/Mobile IP/GRE
  • Various metrics for computing network user-experience
  • Extension to plugins to provide even further information for selected protocols such as HTTP.
You might ask yourself how the nProbe performance has been affected by all these extensions. Obviously the more the nProbe provides, the more CPU cycles are necessary. Nested encapsulations (e.g. Mobile IP encapsulated on GTP, encapsulated on VLANs are pretty common on mobile operators) require more time than “plain old” IP over ethernet. Today with a low-end Xeon (we use Intel E31230) we can handle from 1 Mpps/core (encapsulated GTP traffic with plugins [VoIP, HTTP] enabled) to over 3 Mpps/core with standard NetFlow v5/9. We have also implemented a new command line option called –quick-mode that when used, further speeds up operations a bit (this option is compatible when nProbe is used without plugins enabled).
Now if you really want to handle 10G line rate (14.88 Mpps) the only solution is to distribute the traffic across cores. The latest PF_RING DNA release allows to distribute in hardware (and thus without wasting CPU cycles) symmetric flows (i.e. both directions, sender->receiver and receiver->sender) to the same RX queue (and thus to the same core as explained below), contrary to what standard drivers do. In essence the DNA drivers make sure that your traffic is balanced across cores, so that you can multiply the traffic analysis performance. Example, supposing to have a 4 core + HT (total 8 cores such as Intel E31230) system, with DNA you have 8 RX queues (dna0@0….dna0@7) to which bind nProbe to. So you will bind a nProbe instance per RX queue/per core (8 instances in total) as follows:
  • nprobe -i dna0@0 -w 512000 --cpu-affinity 0
  • ....
  • nprobe -i dna0@7 -w 512000 --cpu-affinity 7
This way each core is kind of a closed system, where scalability is almost linear as each nProbe instance is bound to a core with no cross-core interference. This setup works if your traffic can be balanced across queues, that is usually the case in real networks, and doing some little/simple math you can immediately figure out that with a low-end Xeon you can handle 10 Gbit line rate using a nProbe when emitting standard v5/v9/IPFIX flows. As said earlier your mileage varies according to traffic encapsulation and number of plugins enabled, not to mention other parameters such as the number of concurrent active flows.
Using the above setup you can create a cheap box for 10 Gbit line rate traffic analysis using commodity hardware and ntop software. Commercial solutions featuring the same performance, will probably cost at least two order of magnitudes more than it.

Accelerating Snort with PF_RING DNA

$
0
0

Since some time, PF_RING includes a DAQ (Data AcQuisition library) module for the popular Snort IDS/IPS. With respect to Linux AF_PACKET, the use of PF_RING significantly accelerates all snort operations. We have recently created a new DAQ module that adds native PF_RING DNA support, further accelerating the vanilla PF_RING DAQ module from 20 to 50%. The support of DNA in addition to greater speed, also has the advantage of exploiting symmetric RSS, so that you can run one snort instance per RX queue and be sure that such instance will process a coherent set of packets, property that does not hold with the standard RSS. This is the key for scalability on multi-core systems.

Conceptually the DNA DAQ module is similar to the PF_RING DAQ module in terms of command line options, so users familiar with it can immediately use the new DAQ module. In order to use DNA DAQ you need a DNA-aware adapter.

You can get PF_RING DNA DAQ on the ntop shop site for a little fee that allows us to maintain and develop the code. Universities and research institutions can contact us to get it at no cost.

Usage Examples


  • Running snort in IDS mode
    # snort --daq-dir=/usr/local/lib/daq --daq pfring_dna --daq-mode passive -i dnaX -v -e

    Note that it is possible to specify multiple interfaces by using a comma-separated list.

  • Running snort in IPS mode
    # snort --daq-dir=/usr/local/lib/daq --daq pfring_dna  -i dnaX:dnaY -e -Q

    Note that it is possible to specify multiple interface pairs by using a comma-separated list.


Example of Symmetric RSS + Core Binding


  • IDS
    snort -q --pid-path /var/run --create-pidfile -D -c /etc/snort/snort.conf -l /var/log/snort/dna2_dna3/instance-1 
      --daq-dir=/usr/local/lib/daq --daq pfring_dna --daq-mode passive -i dna2:dna3 --daq-var idsbridge=1 --daq-var bindcpu=1
  • IPS
    snort -q --pid-path /var/run --create-pidfile -D -c /etc/snort/snort.conf -l /var/log/snort/dna2_dna3/instance-1 
      --daq-dir=/usr/local/lib/daq --daq pfring_dna --daq-mode inline -i dna2:dna3 --daq-var bindcpu=1
  • IDS with Multiqueue and Symmetric RSS
    snort -q --pid-path /var/run --create-pidfile -D -c /etc/snort/snort.conf -l /var/log/snort/dna2_dna3/instance-1 
      --daq-dir=/usr/local/lib/daq --daq pfring_dna --daq-mode passive -i dna2@0:dna3@0 --daq-var idsbridge=1 --daq-var bindcpu=0
    snort -q --pid-path /var/run --create-pidfile -D -c /etc/snort/snort.conf -l /var/log/snort/dna2_dna3/instance-2 
      --daq-dir=/usr/local/lib/daq --daq pfring_dna --daq-mode passive -i dna2@1:dna3@1 --daq-var idsbridge=1 --daq-var bindcpu=1
    snort -q --pid-path /var/run --create-pidfile -D -c /etc/snort/snort.conf -l /var/log/snort/dna2_dna3/instance-3 
      --daq-dir=/usr/local/lib/daq --daq pfring_dna --daq-mode passive -i dna2@2:dna3@2 --daq-var idsbridge=1 --daq-var bindcpu=2
    snort -q --pid-path /var/run --create-pidfile -D -c /etc/snort/snort.conf -l /var/log/snort/dna2_dna3/instance-4 
      --daq-dir=/usr/local/lib/daq --daq pfring_dna --daq-mode passive -i dna2@3:dna3@3 --daq-var idsbridge=1 --daq-var bindcpu=3
  • IPS with Multiqueue and Symmetric RSS
    snort -q --pid-path /var/run --create-pidfile -D -c /etc/snort/snort.conf -l /var/log/snort/dna2_dna3/instance-1 
      --daq-dir=/usr/local/lib/daq --daq pfring_dna --daq-mode inline -i dna2@0:dna3@0 --daq-var bindcpu=0
    snort -q --pid-path /var/run --create-pidfile -D -c /etc/snort/snort.conf -l /var/log/snort/dna2_dna3/instance-2 
      --daq-dir=/usr/local/lib/daq --daq pfring_dna --daq-mode inline -i dna2@1:dna3@1 --daq-var bindcpu=1
    snort -q --pid-path /var/run --create-pidfile -D -c /etc/snort/snort.conf -l /var/log/snort/dna2_dna3/instance-3 
      --daq-dir=/usr/local/lib/daq --daq pfring_dna --daq-mode inline -i dna2@2:dna3@2 --daq-var bindcpu=2
    snort -q --pid-path /var/run --create-pidfile -D -c /etc/snort/snort.conf -l /var/log/snort/dna2_dna3/instance-4 
      --daq-dir=/usr/local/lib/daq --daq pfring_dna --daq-mode inline -i dna2@3:dna3@3 --daq-var bindcpu=3


PF_RING DAQ Specific Options


  • Binding an instance to a core grants snort instances not to step on each other’s feet. In order to bind an instance to a specific core do:
     --daq-var bindcpu=<core id>


  • IDS forwarding: if you want to forward incoming packets while snort is running in IDS mode, you can enable the ids bridge mode with:
     --daq-var idsbridge=1

Monitoring on the MicroCloud

$
0
0

When I started to develop ntop in 1998, it was clear to me that the network was a huge, volatile (or semi-persistent if you wish), constantly changing database. In ntop this database is implemented in memory, where for each received packet, ntop updates the hosts, protocols, sessions, packet size….. tables. The web interface is yet another way to view the database contents using a web interface. In order not to exhaust all the available resources (memory in primis), the ntop memory database periodically purges data that is no longer accessed or that aged (e.g. a host that has not made any communication for a while). This original design is still present into the current ntop, and I still believe it’s a good idea to have it like that. What I did wrong (in 1998 I didn’t have too many options, but today the situation is different) was the mix of network knowledge with the database. Namely monitoring applications are just a feed for this network knowledge database, but they should not be a single entity, as this has a few drawbacks: 1) external applications cannot easily access data stored in this memory database 2) the design is not clean as everything is merged instead of splitting the network from the database part.
This summer I had a small accident, and instead of enjoying the summer, I had to stay home to recover. This has been a very creative time, as many people were in vacation (i.e. fewer email to handle) so I had time to code without paying too much attention to other activities. As I was experimenting with the redis database for a while and I liked its clean yet powerful design and mostly because it has the concept of time (or TTL in redis parlance). Namely in redis data can be persistent (i.e. stay on the DB forever) or last for a while that is perfect as network data is volatile. In fact think about ARP caches, DNS caches, NAT entries etc. they all have a lifetime. SQL databases instead do not have the concept of time, and thus you can still purge aged data, but it’s not part of its nature, and it requires some housekeeping activities that complicate the design.

All these facts convinced me to jump on redis, and adopt it into ntop an nProbe. As ntop already had its own in-memory database, I focused on nProbe first. There are many things I like about flow-based probes, but there are also other I dislike, such as the probe-collector model, where most collectors are apps that receive flows, dump them on a SQL database, and run a few queries to render data on a web page. This model make sense as long as there is not a need to correlate flows together (e.g. a SIP flow with its corresponding RTP call) or users to flows (e.g. a radius or GTP user with its traffic) as doing this on a database is slow and a bit complicated to achieve. For this reason I have decided to do two things at once. Namely 1) store the network knowledge on the redis database, and 2) use this network knowledge to perform on-the-probe flow aggregation so that collectors can receive pre-aggregated data and thus has an easy life. This is what I called microcloud.

In the microcloud several database nodes are federated together, you can replicate data, monitor what is stored/deleted from the cache, dump a snapshot of your data. The latest nprobe version speaks with redis my means of the “–redis <host>” parameter so that nprobe stored into redis the temporary mappings (e.g. radius mapping). Of course external applications can access the redis DB and have an aggregated view of the network.


Thanks to redis you can correlate traffic flows coming from various network trunks that are monitored by various probes, or from various probes monitoring traffic on the same host. However them microcloud is more than just flow correlation. If you add to nProbe “–ucloud” nprobe stores into the microcloud information about traffic. Namely you can have the same view you have on ntop (hosts, application protocols etc) with nProbe, at a greater speed, available to all apps and not just nprobe. You can see in realtime without going through flow collection, what is happening on your network. Easily. When hosts or the info is no longer fresh (e.g. a host has stopped sending data), the microcloud, leveraging on redis TTL mechanism, automatically discards this data preserving your resources. Note that on the microcloud you can find much more than IP, bytes, and packets. Thanks to it, nProbe can for instance tell you, flow-by-flow, who is the user sending such flow (if radius or GTP information is available), what is the real host accessed (i.e. nProbe like ntop, via the DNS plugin, creates a per-host DNS cache on the microcloud), and anything else you can hardly do on collectors.

The microcloud concept however is much more than that. Imagine to store, or to make it available via the microcloud paradigm, data about your component configuration , network equipment, devices etc. This would enable users to correlate multiple data together, so that you can produce records like “Luca using his iPhone has accessed the ntop blog”, instead of dealing with IP addresses and ports. Namely the comprehensive integration of all this data make the microcloud a powerful concept. This would push monitoring beyond “curiosity of what is happening on the network”. Imagine if a firewall could exploit this info to update its security policy, or is snort could populate the microcloud with reports about blocked sessions (BTW we’ll be soon integrate this into the upcoming PF_RING DAQ adapter), so that you can also create a security score for all your network devices. For the time being, you can enjoy the microcloud on nProbe. We await your feedback to improve this novel concept we’ve just introduced.

Using n2disk for 10 Gbit line-rate packet-to-disk

$
0
0

Packet-to-disk is the ability to dump network packets to disk. This activity is important for implementing a sort of “network time machine” so that when something unexpected happens, you have the ability to access the raw packets and thus inspect the cause of the problems. Implementing efficient packet-to-disk requires high-speed packet capture, speedy disks, and efficient packet dump software.

We started to work on this field, a few years ago when creating a packet-to-disk application for 1 Gbit networks, named n2disk. Today we are introducing the second generation of n2disk that has been further optimised for 10 Gbit networks. Leveraging on PF_RING DNA, n2disk can dump packets on disk using the industry-standard pcap format at 10 Gbit line rate, minimal size packets. All you need to have is a fast storage system and an adequate system to run n2disk on. As you can read on the n2disk home page, we have the ability to:

  • Filter packets during capture using BPF-like filters.
  • Dump packets with nano-second timestamps (precise timestamping card required such as Silicom 10G timestamp adapter).
  • Index packets on the fly, during packet capture, for fast packet retrieval.
  • Search disk-stored packets within a specified time-boundary, using BPF-like filters leveraging on the n2disk packet search companion tools.

Unlike costly  proprietary packet-to-disk solutions, n2disk can run on commodity hardware using DNA-aware network adapters. Contrary to the common belief that packet-to-disk solutions are expensive and based on proprietary (i.e. non-pcap) dump formats, n2disk demonstrates that this statement is no longer true making packet-to-disk a commodity activity.

For more information about n2disk features and configuration options, please refer to the n2disk home page and n2disk User’s Guide. Those who are looking for an affordable turn-key packet-to-disk solution, can instead have a look at the nBox recorder.


PF_RING 5.5.0 Released

$
0
0
  1. New libzero features
    • DNA Cluster: number of per-consumer rx/tx queue slots and number of additional buffers can be configured via dna_cluster_low_level_settings()
    • hugepages support (pfdnacluster_master/pfdnacluster_multithread -u option)
  2. New PF_RING-aware libpcap features
    • added PF_RING_ACTIVE_POLL environmental variable to enable active polling when defined to 1
    • enable rehash rss setting env var PF_RING_RSS_REHASH=1
    • cluster type selectable via env vars:
    • PCAP_PF_RING_USE_CLUSTER_PER_FLOW
    • PCAP_PF_RING_USE_CLUSTER_PER_FLOW_2_TUPLE
    • PCAP_PF_RING_USE_CLUSTER_PER_FLOW_4_TUPLE
    • PCAP_PF_RING_USE_CLUSTER_PER_FLOW_TCP_5_TUPLE
    • PCAP_PF_RING_USE_CLUSTER_PER_FLOW_5_TUPLE
  3. New PF_RING-aware drivers
    • Updated Intel drivers to make them compatible with newer kernels
  4. New PF_RING library features
    • new pfring_open() flag PF_RING_HW_TIMESTAMP for enabling hw timestamp
  5. New PF_RING kernel module features
    • handle_user_msg hook for sending msg to plugins
    • SO_SEND_MSG_TO_PLUGIN setsockopt for sending msgs from userspace
    • pf_ring_inject_packet_to_ring for inserting packets in a ring identified by )
    • possibility to redefine the rehash_rss function
  6. Snort PF_RING-DAQ module
    • new configure –with-pfring-kernel-includes option
    • fix for -u -g
  7. DNA drivers fixes
    • Compilation with RHEL 6.3
    • igb drop stats fix
  8. Sample app new features
    • new pfcount.c -s option for enabling hw timestamp
    • new pfdnacluster_multithread option for absolute per-interface stats
  9. Sample apps fixes
    • vlan parsing
    • compilation fix for HAVE_ZERO not set
    • pfcount fix for reentrant mode
    • core binding fixes
  10. PF_RING kernel module fixes
    • channel_id handling
    • fix for hash with cluster type in cluster_per_flow_*
    • important fix for standard pf_ring (BUG #252: extra packets with wrong size)
    • max caplen 16384 increased to 65535 (max 16 bit)
    • fix for handling packets with stripped VLAN IDs
  11. Misc changes
    • Initial work on changelog maintenance
    • Binary packages for Ubuntu/RedHat/CentOS x64 available at http://packages.ntop.org.

BYO10GPR: Build Your Own 10 Gbit Packet Recorder

$
0
0

Packet recorder appliances are one of the last network components that have insane prices. Years ago this was justified by the fact that in order to capture traffic at high speed it was mandatory to use costly custom packet capture cards and often custom-designed hardware. With the advent of multi-10 Gbit packet capture technologies on commodity hardware such as PF_RING DNA, and the availability of high-performance computers such as those based on the Intel Sandy Bridge chipset the game has changed. Modern 10K RPM 6Gb/s SATA disks enable with 8 disks in RAID-0 the creation of an inexpensive storage system able to write to disk 10 Gbit of traffic. Of course you can use fewer disks if you plan to use SSD drives, as SSD duration issues seem to have been mostly solved on the latest drives generation.

However the hardware is just a part of the game, as putting speedy components into the same box does not make a fast packet recorder system. The reasons are manyfold:

  • Modern CPUs are going to be more energy efficient, so the CPU clock changes according to the load. Users must pay attention to configure the system in a way that CPU efficiency is constant (tools like cpufreq allows you to specify this, and i7z allows you to see what happens) or this might lead to packet loss during traffic peaks as the CPU is not quick enough to increase its speed as network traffic changes.
  • Latest Intel CPUs such as the E5 series used in high-end (uniprocessor and multiprocessor NUMA) servers, have typically low clock speeds (typically 1.8-2.0 GHz) in its entry/mid-range, whereas if you need clocks over 2.4 GHz, be prepared to spend a significant budget.
  • 10 Gbit NICs must be attached to the same node (of a NUMA system) where your n2disk application is running. As people often use dual 10 Gbit ports, do not make the mistake to run one n2disk instance per port, each on a different node to balance the system. In fact the dual-10 Gbit NIC is physically attached to a single PCIe slot, and thus to a single node. This way, the second n2disk instance running on the second NUMA node will not access packets directly but via the QPI bus thus decreasing its performance. In this case it’s way better to use two single-port 10 Gbit NICs, and connect each card to a PCIe slot attached to the node where n2disk is active, thus avoiding to cross the QPI bus. Note that we do not claim that in order to monitor 2 x 10 Gbit links (or a single 10 Gbit link monitored via a network tap that splits the two traffic directions across two ports) you need a two node NUMA system as one uniprocessor system might be enough; instead we want you to realise that simple equations such as one node = one 10 Gbit port, might be more complicated than expected.
  • At 10 Gbit, in particular if you want to index packets (for quick packet search without the need to sequentially search your multi-Terabyte archive) during packet capture as n2disk does, you need to use a hardware system able to deliver enough horse-power to carry on the packet capture job. In other words you need to have a CPU that has enough GHz to provide n2disk enough CPU cycles for carrying-on its task. Typically 2 GHz are almost sufficient (i.e. they are sufficient but you are very close to the physical limit of number of cycles available per packet), but at least 2.4 GHz are better to be on the safe side.

With our reference box based on Supermicro X9SCL powered by a Xeon E3-1230 (for storage we use a SATA LSI raid controller), we can capture to disk on dna0 while indexing packets in realtime with no loss, while injecting 10 Gbit (14.88 Mpps with 60+4 bytes packets) on dna1. The commands we used are:

  •  n2disk10g -i dna1 -o /tmp -p 1000 -b 2000 -q 0 -C 256 -S 0 -w 1 -c 2 -s 64 -R 3,4,5 -I
    .....
    23/Nov/2012 11:09:18 [n2disk.c:1196] [writer] Creating index file /tmp/35.pcap.idx
    23/Nov/2012 11:09:18 [n2disk.c:409] [PF_RING] Partial stats: 13760489 pkts rcvd/13760489 pkts filtered/0 pkts dropped [0.0%]
    23/Nov/2012 11:09:18 [n2disk.c:1101] [writer] Creating pcap file /tmp/36.pcap
    23/Nov/2012 11:09:19 [n2disk.c:1196] [writer] Creating index file /tmp/36.pcap.idx
    23/Nov/2012 11:09:19 [n2disk.c:409] [PF_RING] Partial stats: 13759959 pkts rcvd/13759959 pkts filtered/0 pkts dropped [0.0%]
    .....
  • pfsend -i dna0 -g 0
    .....
    TX rate: [current 14'880'821.24 pps/10.00 Gbps][average 14'877'984.82 pps/10.00 Gbps][total 5'977'466'918.00 pkts]
    .....
During this test, i7z was reporting:
Cpu speed from cpuinfo 3192.00Mhz
cpuinfo might be wrong if cpufreq is enabled. To guess correctly try estimating via tsc
Linux's inbuilt cpu_khz code emulated now
True Frequency (without accounting Turbo) 3192 MHz
 CPU Multiplier 32x || Bus clock frequency (BCLK) 99.75 MHz

Socket [0] - [physical cores=4, logical cores=8, max online cores ever=4]
 TURBO ENABLED on 4 Cores, Hyper Threading ON
 Max Frequency without considering Turbo 3291.75 MHz (99.75 x [33])
 Max TURBO Multiplier (if Enabled) with 1/2/3/4 Cores is  36x/35x/34x/33x
 Real Current Frequency 3291.96 MHz [99.75 x 33.00] (Max of below)
       Core [core-id]  :Actual Freq (Mult.)      C0%   Halt(C1)%  C3 %   C6 %   C7 %  Temp
       Core 1 [0]:       3291.75 (33.00x)       100       0       0       0       0    45
       Core 2 [1]:       3291.96 (33.00x)      21.6    77.8       0       0       0    41
       Core 3 [2]:       3291.86 (33.00x)      50.3    48.1       0       0       0    39
       Core 4 [3]:       3291.89 (33.00x)      39.5    59.2       0       0       0    38

C0 = Processor running without halting
C1 = Processor running with halts (States >C0 are power saver)
C3 = Cores running with PLL turned off and core cache turned off
C6 = Everything in C3 + core state saved to last level cache
 Above values in table are in percentage over the last 1 sec
[core-id] refers to core-id number in /proc/cpuinfo
'Garbage Values' message printed when garbage values are read


In essence if you have a fast storage, 20 Gbit to disk with 60+4 bytes packets is no longer a dream on commodity hardware.

Just to make this long story short, in order to BYO10GPR you need:

  • A fast (but not too fast) storage system.
  • Format and mount the disks properly (see the n2disk user’s guide that explains you how to do that) as a fast storage handled as a dummy disk won’t deliver the performance you need.
  • A CPU of at least 2.0 GHz, although we suggest 2.4 GHz or better. If you want to save money and be on the safe side, you better consider E3 CPU series (we use E3-1230 as explained previously) that for about 200$ delivers 3.2 GHz. If you want to use an E5 processor with 2.7 GHz, you need to spend almost an order of magnitude more.
  • A wise configuration of n2disk, so that the threads are allocated properly on cores.
  • Use of DNA drivers on the interfaces used for packet capture.

For those who do not want to deal with all these low-end details, of course can use one of the nBox recorders we pre-build for you.

PF_RING 5.5.1 Released

$
0
0

ChangeLog

  • Updated PF_RING-aware ixgbe driver (3.11.33).
  • Update PF_RING-aware igb (4.0.17).
  • Fixed bug that was causing ixgbe driver not to disable interrupts. This was causing a high load on the core handling the interrupts for ixgbe-based card.
  • libzero: various hugepages improvements and bug fixes.
  • Added ability to specify PF_RING_RX_PACKET_BOUNCE in pfring_open().
  • Fixed minor PF_RING memory leak.
  • Various improvements to support of hardware timestamp on Silicom Intel-based 10 Gbit adapters.
  • DNA Bouncer: added direction to pfring_dna_bouncer_decision_func callback (useful in bidirectional mode).
  • DNA Cluster: added dna_cluster_set_hugepages_mountpoint() to manually select the hugepages mount point when several are available.
  • Created architecture specific versions of libzero/DNA for exploiting latest generation of CPUs and thus improve performance.
  • Added pf_ring calls to pcap apps for exploiting PF_RING acceleration even from pcap.

Not All Servers Are Alike (With DNA) – Part 2

$
0
0

Some time ago, we discussed on the first part of this post, why not all servers spot the same performance with DNA. The conclusion was that beside the CPU, you need a great memory bandwidth in order to move packets from/to the NIC. So in essence CPU+memory bandwidth are necessary for granting line-rate performance.

In this post we want to add some lessons learnt while playing with DNA on modern servers.

Lesson 1: Not all PCIe slots are alike


With the advent of PCIe gen3, computer manufacturers started to mix (old) PCIe gen2 with gen3 slots onto the same machine. In order to have a smaller set of components, quite often, manufacturers use the same physical PCIe slot connector for gen2/gen3. The same applies to slot speed, where x4 slots are shorter than x8 slots. So in essence, when you need to plug your 10G adapter into your brand new server, do not look at the slot form factor to figure out if this is the correct slot, but do read on the motherboard (or on the companion manual) the slot speed prior to plug your NIC. This will save you headaches.

Lesson 2: 2 x single-port 10G NIC != 1 x dual-port 10G NIC


After you have selected a PCIe slot on which to plug your 10G card, you need to figure out what are your plans. Considered the little difference in cost between a single and a dual 10G card, many people prefer to buy the dual-port (if not the quad or six ports) and believe that all those cards are alike. Not quite. In fact you need to understand that beside the NIC form factor, the hardware manufacturer had to interconnect all those ports in some way. Usually this happens via a PCIe bridge that interconnects the various ports similar to what a USB hub does for your PC devices. Whenever you pass through a bridge, the bandwidth available is reduced so this might be a potential bottleneck. So make sure that your 10G NIC uses a PCIe gen3 bridge for your many-ports 10G card, otherwise expect packet drops due to the physical form factor of your NIC.

With modern Sandy Bridge systems, PCIe slots are connected directly to the CPU. If you use a NUMA system (e.g. you have a system with two physical CPUs), connecting a dual port 10G NIC to a slot, means that you are binding all the two slots to such CPU. If your application accessing the NIC is running on the other CPU (i.e. not the same CPU to which your dual-port is connected) then your application will end up accessing the card via the first CPU and the QPI bus (that interconnects the CPUs). In essence this is a bad idea as your performance will be reduced due to the long journey and memory coherency (a packet memory allocated on the first CPU is accessed by the second CPU). If you plan to use this architecture, you better use instead two single-port 10G NICs, and plug one card on the first CPU, and the second card on the second CPU. This will grant you line-rate any packet size.

Lesson 3: Energy efficiency might not be your best friend


Modern CPUs such as Intel E5 have a variable clock speed, that changes according to the amount of work the CPU has to carry on, so that the CPU can save energy when possible. This means that the clock of your CPU is not stable, but it changes based on the CPU load. Tools like i7z allow you to monitor the CPU clock realtime. In the system BIOS you can set how you plan to use your CPU (energy efficient, performance, balance) and in your Linux system you can set how software plans to use the CPU. Depending on BIOS and kernel configuration, you can obtain very bad or very good results. For example on our uniprocessor sandy bridge system using E5-2620 this is what happens.

  1. CPU Power Management Configuration disabled on BIOS:
    root@nbox:/home/deri/PF_RING/drivers/DNA/ixgbe-3.10.16-DNA/src# /home/deri/PF_RING/userland/examples/pfsend -i dna0 -g 3
    Sending packets on dna0
    Using PF_RING v.5.5.2
    Using zero-copy TX
    TX rate: [current 12'850'010.49 pps/8.64 Gbps][average 12'850'010.49 pps/8.64 Gbps][total 12'850'139.00 pkts]
    TX rate: [current 12'852'422.34 pps/8.64 Gbps][average 12'851'216.44 pps/8.64 Gbps][total 25'703'114.00 pkts]
    
  2. CPU Power Management Configuration set on BIOS to Performance
    root@nbox:/home/deri/PF_RING/drivers/DNA/ixgbe-3.10.16-DNA/src# /home/deri/PF_RING/userland/examples/pfsend -i dna0 -g 3 
    Sending packets on dna0
    Using PF_RING v.5.5.2
    Using zero-copy TX
    TX rate: [current 14'708'669.91 pps/9.88 Gbps][average 14'708'669.91 pps/9.88 Gbps][total 14'708'817.00 pkts]
    TX rate: [current 14'727'932.58 pps/9.90 Gbps][average 14'718'301.54 pps/9.89 Gbps][total 29'437'810.00 pkts]
    
  3. Same as 2 but we add -a (active polling) to pfsend
    root@nbox:/home/deri/PF_RING/drivers/DNA/ixgbe-3.10.16-DNA/src# /home/deri/PF_RING/userland/examples/pfsend -i dna0 -g 3 -a
    Sending packets on dna0
    Using PF_RING v.5.5.2
    Using zero-copy TX
    TX rate: [current 14'880'666.69 pps/10.00 Gbps][average 14'868'674.49 pps/9.99 Gbps][total 29'737'914.00 pkts]
    TX rate: [current 14'880'562.38 pps/10.00 Gbps][average 14'872'637.12 pps/9.99 Gbps][total 44'618'774.00 pkts]
    

As you can see the performance is very different. The reason is the CPU speed that changes according to the power management configuration. In the 2. case i7z reports

Socket [0] - [physical cores=6, logical cores=12, max online cores ever=6]
 TURBO ENABLED on 6 Cores, Hyper Threading ON
 Max Frequency without considering Turbo 2098.95 MHz (99.95 x [21])
 Max TURBO Multiplier (if Enabled) with 1/2/3/4/5/6 Cores is 25x/25x/24x/24x/23x/23x
 Real Current Frequency 1226.46 MHz [99.95 x 12.27] (Max of below)
 Core [core-id] :Actual Freq (Mult.) C0% Halt(C1)% C3 % C6 % C7 % Temp
 Core 1 [0]: 1199.34 (12.00x) 1.22 0.969 0 0 98.3 29
 Core 2 [1]: 1199.59 (12.00x) 1 0.0213 0 0 100 33
 Core 3 [2]: 1198.16 (11.99x) 1 0.0263 0 0 100 28
 Core 4 [3]: 1199.38 (12.00x) 71 57.4 0 0 0 39
 Core 5 [4]: 1180.98 (11.82x) 1 0.0362 0 0 99.9 32
 Core 6 [5]: 1226.46 (12.27x) 1 0.0361 0 0 99.9 30

whereas in 3. it reports

Socket [0] - [physical cores=6, logical cores=12, max online cores ever=6]
 TURBO ENABLED on 6 Cores, Hyper Threading ON
 Max Frequency without considering Turbo 2098.95 MHz (99.95 x [21]) 
 Max TURBO Multiplier (if Enabled) with 1/2/3/4/5/6 Cores is 25x/25x/24x/24x/23x/23x
 Real Current Frequency 2498.64 MHz [99.95 x 25.00] (Max of below) 
 Core [core-id] :Actual Freq (Mult.) C0% Halt(C1)% C3 % C6 % C7 % Temp
 Core 1 [0]: 2485.39 (24.87x) 1 0.301 0 0 99 31
 Core 2 [1]: 2390.24 (23.91x) 1 0.041 0 0 99.9 34
 Core 3 [2]: 2318.51 (23.20x) 0 0.0343 0 0 100 30
 Core 4 [3]: 2498.64 (25.00x) 100 0 0 0 0 42
 Core 5 [4]: 2445.43 (24.47x) 1 0.0328 0 0 99.9 32
 Core 6 [5]: 2416.29 (24.18x) 1 0.0358 0 0 99.9 31

In essence during test 2. the core 3 (where pfsend was running) was running at 1.19 GHz, whereas on test 3. it was running at 2.49 GHz. This explains the difference in performance. If you are monitoring network traffic, you better pay attention to these details, as otherwise you will be disappointed by the performance you achieve. Please note that you can set the CPU speed and scheduler from software using tools such as cpufreq-set.

Conclusion


In addition to what we discussed in the  first part, make sure that you understand the topology of your computer and the power configuration of your system, otherwise you might obtain some unexpected results from speedy (and costly) modern computer system.

Monitoring Mobile Networks (2G, 3G, and LTE) using nProbe

$
0
0

Monitoring mobile networks traffic has been traditionally perceived by the telecommunications industry as something complex, costly, proprietary. This is unfortunately one of the few fields where the open-source movement  has not been able to spread much, where vendor lock-in is still the standard. Last year we visited the Mobile World Congress in Barcelona to understand more about this world (btw, it’s a crazy expo as the  cheapest entry ticket costs 900$ and up), and the conclusion is that mobile terminals are pretty open thanks to Android, but the network is still very close. This has been the driving force for adding to nProbe the ability to analyse mobile traffic.

Our goal has been the monitoring of mobile network traffic, similar to what happens on standard IP networks in order to answer with some extras. In mobile networks, there is a protocol called GTP (GPRS Tunnelling Protocol) that is decomposed in two separate protocols:

  • GTP-U: used to carry user-data traffic, i.e. the network traffic you make with your handheld when accessing the Internet (e.g. email, web surfing, gaming).
  • GTP-C: used to carry signalling within the GPRS core network. Whenever you connect/disconnect, hop inside the network with your handheld, the network generates a message. Monitoring GTP-C is the key for keeping and association between a user (i.e. IMSI) and the dynamic IP address associated to the user within the mobile network. There is much more than this in GTP-C, such as the user phone number, the cell where the user is connected (and thus it’s physical location), the APN, and the handheld model. GTP-C  is used to negotiate tunnel Ids, that are then used to carry user traffic, so GTP-C traffic state must be kept somewhere on a a database  in order to keep the association between a user and its IP address.

GTP-C is handled with two plugins (gtpv1 and gtpv2 plugins), as well the radius protocol.  The nProbe core instead has been updated to support many protocol and encapsulations used on mobile networks such as:

All existing nProbe plugins have been updated so GTP-C is now first-class citizen. This means for instance that when nProbe sees some GTP-encapsulated HTTP traffic, along with the usual information (URL, Cookies, User-Agent….) information about the user who generated this traffic is also returned (i.e. the IMSI). This information correlation is implemented transparently in nProbe using the microcloud paradigm.

MicroCloud

Whenever nProbe sees some GTP-C message, it dynamically (and automatically) updates the user status into the redis database, so that this information can be user to bind GTP-U to users.

Another advantage of the microcloud architecture, is that it allows traffic  to be correlated across various probes. In fact mobile networks are distributed by nature, and it is usually not possible to aggregate all traffic into a single place. The microcloud allows all probes to share data (of course data caching is implemented on teach nProbe instance to avoid too many communications), so that all combinations are supported.

PF_RING-GTP

PF_RING clustering has also been updated so that whenever a server running nProbe, incoming traffic can shared across all running nProbe instances. This happens by honouring GTP tunnelling as PF_RING will not balance on the external packet envelope but on tunnelled traffic. Using this approach, PF_RING allows incoming network traffic (also on multiple incoming interfaces)  to be balanced across multiple instances and thus to monitor multi-Gbit traffic on a single server.

Of course nDPI is able to dissect GTP-encapsulated traffic, and thus you can configure nProbe (by means of the specified template, -T) to analyse traffic at application level and thus learn the layer-7 protocol.

nProbe can export information via NetFlow v9/IPFIX using the following information elements:

Plugin GTPv1 Signaling Protocol templates:
[NFv9 57692][IPFIX 35632.220] %GTPV1_REQ_MSG_TYPE GTPv1 Request Msg Type
[NFv9 57693][IPFIX 35632.221] %GTPV1_RSP_MSG_TYPE GTPv1 Response Msg Type
[NFv9 57694][IPFIX 35632.222] %GTPV1_C2S_TEID_DATA GTPv1 Client->Server TunnelId Data
[NFv9 57695][IPFIX 35632.223] %GTPV1_C2S_TEID_CTRL GTPv1 Client->Server TunnelId Control
[NFv9 57696][IPFIX 35632.224] %GTPV1_S2C_TEID_DATA GTPv1 Server->Client TunnelId Data
[NFv9 57697][IPFIX 35632.225] %GTPV1_S2C_TEID_CTRL GTPv1 Server->Client TunnelId Control
[NFv9 57698][IPFIX 35632.226] %GTPV1_END_USER_IP GTPv1 End User IP Address
[NFv9 57699][IPFIX 35632.227] %GTPV1_END_USER_IMSI GTPv1 End User IMSI
[NFv9 57700][IPFIX 35632.228] %GTPV1_END_USER_MSISDN GTPv1 End User MSISDN
[NFv9 57701][IPFIX 35632.229] %GTPV1_END_USER_IMEI GTPv1 End User IMEI
[NFv9 57702][IPFIX 35632.230] %GTPV1_APN_NAME GTPv1 APN Name
[NFv9 57703][IPFIX 35632.231] %GTPV1_MCC GTPv1 Mobile Country Code
[NFv9 57704][IPFIX 35632.232] %GTPV1_MNC GTPv1 Mobile Network Code
[NFv9 57705][IPFIX 35632.233] %GTPV1_CELL_LAC GTPv1 Cell Location Area Code
[NFv9 57706][IPFIX 35632.234] %GTPV1_CELL_CI GTPv1 Cell CI
[NFv9 57707][IPFIX 35632.235] %GTPV1_SAC GTPv1 SAC
Plugin GTPv2 Signaling Protocol templates:
[NFv9 57742][IPFIX 35632.270] %GTPV2_REQ_MSG_TYPE GTPv2 Request Msg Type
[NFv9 57743][IPFIX 35632.271] %GTPV2_RSP_MSG_TYPE GTPv2 Response Msg Type
[NFv9 57744][IPFIX 35632.272] %GTPV2_C2S_S1U_GTPU_TEID GTPv2 Client->Svr S1U GTPU TEID
[NFv9 57745][IPFIX 35632.273] %GTPV2_C2S_S1U_GTPU_IP GTPv2 Client->Svr S1U GTPU IP
[NFv9 57746][IPFIX 35632.274] %GTPV2_S2C_S1U_GTPU_TEID GTPv2 Srv->Client S1U GTPU TEID
[NFv9 57747][IPFIX 35632.275] %GTPV2_S2C_S1U_GTPU_IP GTPv2 Srv->Client S1U GTPU IP
[NFv9 57748][IPFIX 35632.276] %GTPV2_END_USER_IMSI GTPv2 End User IMSI
[NFv9 57749][IPFIX 35632.277] %GTPV2_END_USER_MSISDN GTPv2 End User MSISDN
[NFv9 57750][IPFIX 35632.278] %GTPV2_APN_NAME GTPv2 APN Name
[NFv9 57751][IPFIX 35632.279] %GTPV2_MCC GTPv2 Mobile Country Code
[NFv9 57752][IPFIX 35632.280] %GTPV2_MNC GTPv2 Mobile Network Code
[NFv9 57753][IPFIX 35632.281] %GTPV2_CELL_TAC GTPv2 Tracking Area Code
[NFv9 57754][IPFIX 35632.282] %GTPV2_SAC GTPv2 Cell Identifier
Plugin Radius Protocol templates:
[NFv9 57712][IPFIX 35632.240] %RADIUS_REQ_MSG_TYPE RADIUS Request Msg Type
[NFv9 57713][IPFIX 35632.241] %RADIUS_RSP_MSG_TYPE RADIUS Response Msg Type
[NFv9 57714][IPFIX 35632.242] %RADIUS_USER_NAME RADIUS User Name (Access Only)
[NFv9 57715][IPFIX 35632.243] %RADIUS_CALLING_STATION_ID RADIUS Calling Station Id
[NFv9 57716][IPFIX 35632.244] %RADIUS_CALLED_STATION_ID RADIUS Called Station Id
[NFv9 57717][IPFIX 35632.245] %RADIUS_NAS_IP_ADDR RADIUS NAS IP Address
[NFv9 57718][IPFIX 35632.246] %RADIUS_NAS_IDENTIFIER RADIUS NAS Identifier
[NFv9 57719][IPFIX 35632.247] %RADIUS_USER_IMSI RADIUS User IMSI (Extension)
[NFv9 57720][IPFIX 35632.248] %RADIUS_USER_IMEI RADIUS User MSISDN (Extension)
[NFv9 57721][IPFIX 35632.249] %RADIUS_FRAMED_IP_ADDR RADIUS Framed IP
[NFv9 57722][IPFIX 35632.250] %RADIUS_ACCT_SESSION_ID RADIUS Accounting Session Name
[NFv9 57723][IPFIX 35632.251] %RADIUS_ACCT_STATUS_TYPE RADIUS Accounting Status Type
[NFv9 57724][IPFIX 35632.252] %RADIUS_ACCT_IN_OCTETS RADIUS Accounting Input Octets
[NFv9 57725][IPFIX 35632.253] %RADIUS_ACCT_OUT_OCTETS RADIUS Accounting Output Octets
[NFv9 57726][IPFIX 35632.254] %RADIUS_ACCT_IN_PKTS RADIUS Accounting Input Packets
[NFv9 57727][IPFIX 35632.255] %RADIUS_ACCT_OUT_PKTS RADIUS Accounting Output Packets


and as well save traffic information on dump files using some command line options:

--gtpv1-dump-dir <dump dir> | Directory where GTPv1 logs will be dumped
--gtpv1-exec-cmd <cmd> | Command executed whenever a directory has been dumped
--gtpv2-dump-dir <dump dir> | Directory where GTPv2 logs will be dumped
--gtpv2-exec-cmd <cmd> | Command executed whenever a directory has been dumped
--radius-dump-dir <dump dir> | Directory where Radius logs will be dumped
--radius-exec-cmd <cmd> | Command executed whenever a directory has been dumped


In essence nDPI, PF_RING and nProbe are now able to monitor multi-Gbit mobile traffic and automatically correlate GTP-C to GTP-U traffic in the probe using the microcloud without doing it on the collector as other tools do. The advantage is that as soon as a flow is exported, the collector immediately knows the mobile user that has generated the traffic not to mention that correlation implemented on the collector is costly in terms of computing resources.  As the information in the microcloud is persistent, in the unlikely case of crash, nothing is lost as the user-to-GTP traffic correlation is maintained in the microcloud. This also applies in case mobile traffic grows and additional probes need to be started (also on different network locations that are still connected via IP to the microcloud): they automatically, since their startup, are able to correlate user-to-traffic.

To date, nProbe is used to permanently monitor the traffic of some country-wide mobile operators. If you are interested in testing it into your environment, you can download a ready-to-user nProbe binary package and have fun!

Viewing all 544 articles
Browse latest View live