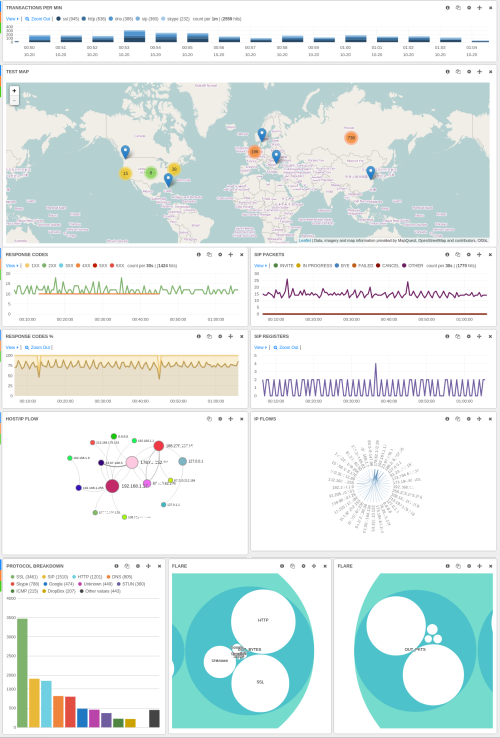
ntopng allows you to export monitoring data do external sources. For low-traffic sites, SQLite and the ntopng historical interface can be a good option. As your traffic increases you are forced to put your data on a database if you care about performance and long-term data persistency.
In future ntopng versions we will add support for additional databases, but for the time being we decided to start with the ELK (ElasticSearch + LogStash + Kibana) paradigm. In this case ElasticSearch (ES) is the database backend, and Kibana the GUI used to report data. As ntopng is able to natively export data in ElasticSearch, we do not need to use LogStash at all.
Supposed you have installed your ElasticSearch and Kibana instance on host XYZ (that can very well be the same host where ntopng is running) all you need to do to start data export is to start ntopng as follows:
ntopng -F “es;<ES Index Type>;<ES Index Name>;<ES URL>;<ES pwd>”
so something like this should work for most of you
ntopng -F “es;flows;ntopng-%Y.%m.%d;http://XYZ:9200/_bulk;”
In ES parlance an index is what a table is on a relational database. In order to avoid putting all data in a single index (ES can harvest old data with you by configuring the data retention), ntopng will create a daily index automatically for you by using the index name specified on the command line. By default (unless you configure it) ES does not use a password to protect data, so you can leave the password field blank. Make sure that you do not change the /_bulk/ URL as ES likes it that way (of course you can change the host name and port).
Once started, ntopng will push ES flows that are expired or periodically send (every 5 mins) partial flows for long lasting flows. By connecting to Kibana using a web browser you can immediately start seeing incoming flows appear in realtime.
You can click on each individual flow and display all the flow attributes
Now it is time you to create a custom dashboard and report you data on a graphical interface.
A good starting point is Qbana, a github project designed to display monitoring data produced by ntopng/nProbe using Kibana
We would be delighted if ntop users could contribute with Kibana dashboards that we could share inside the community. So please be generous and send us your contribution that we’ll then share with the ntop community.


