Splunk is a popular realtime data capture, aggregation, and data visualisation system. Designed initially for handling application logs, in its current version is available with a free enterprise license can index up to 500 megabytes of data per day. We have decided to use Splunk to capture and index in realtime flows generated by nProbe, and in particular those that contain non-numerical information, such as HTTP URLs for instance. The versatile of splunk is such that it can be easily customised with a few mouse clicks, so that new reports, views and triggers can be created in second. Hence we have create a free nProbe Splunk Application (released under GPLv3 and platform independent so you can run it for instance on Linux, Windows or MAC OSX) that you can use as graphical monitoring console for nProbe. All details are explained in the nProbe Splunk QuickStart Guide, but the impatient can read this quick short guide:
- You need nProbe 6.16 or newer, that you can use as flow probe and/or collector. nProbe will send splunk flow information (in essence nProbe is a flow producer and splunk a flow collector) formatted in JSON. For instance you can start nProbe as follows (note the –tcp <host>:<port> that specified the Splunk host collection port implemented by the nProbe-Splunk App)
nprobe -T “%IPV4_SRC_ADDR %L4_SRC_PORT %IPV4_DST_ADDR %L4_DST_PORT %PROTOCOL %IN_BYTES %OUT_BYTES %FIRST_SWITCHED %LAST_SWITCHED %HTTP_SITE %HTTP_RET_CODE %IN_PKTS %OUT_PKTS %IP_PROTOCOL_VERSION %APPLICATION_ID %L7_PROTO_NAME %ICMP_TYPE” –tcp “127.0.0.1:3333″ -b 2 -i eth0 –json-labels
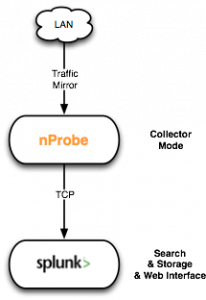
![Splunk Architecture]() Via the nProbe Splunk app we have developed, Splunk will start receiving flows and index them in realtime.
Via the nProbe Splunk app we have developed, Splunk will start receiving flows and index them in realtime.- The nProbe Splunk application will then start populating the defined reports as depicted in the image gallery below.
The reports we created, in addition to “classic” host/traffic information (top hosts, top application protocols [via nDPI] etc.), allow for instance to depict the top HTTP sites accessed, the mime-types or return code. As manipulating text is one of the things Splunk does well (usually flow-collectors are good with IPs and ports but not with text), you don’t have to be afraid to use the application for creating custom reports based on text. We have implemented HTML reports, but nothing prevents you from creating similar reports for VoIP, email or mobile traffic (e.g. top IMSI or APN). nProbe (via the new –tcp command line flag and its revamped JSON engine) can export all plugin information to splunk, and you can create your own reports in a few clicks using the application we developed.
As we are giving away for free the Splunk application, we hope that users will contribute to it and send us patches so that we can make them available to the whole community. Many thanks to our colleague Filippo for leading this project.
Enjoy!
